
Spend Analysis for Engineered Equipment (Free Template)
How to run a spend analysis for pumps, valves, instruments and packages: data sources, cleaning, supplier grouping, classification, what to look for, and a column template you can copy.
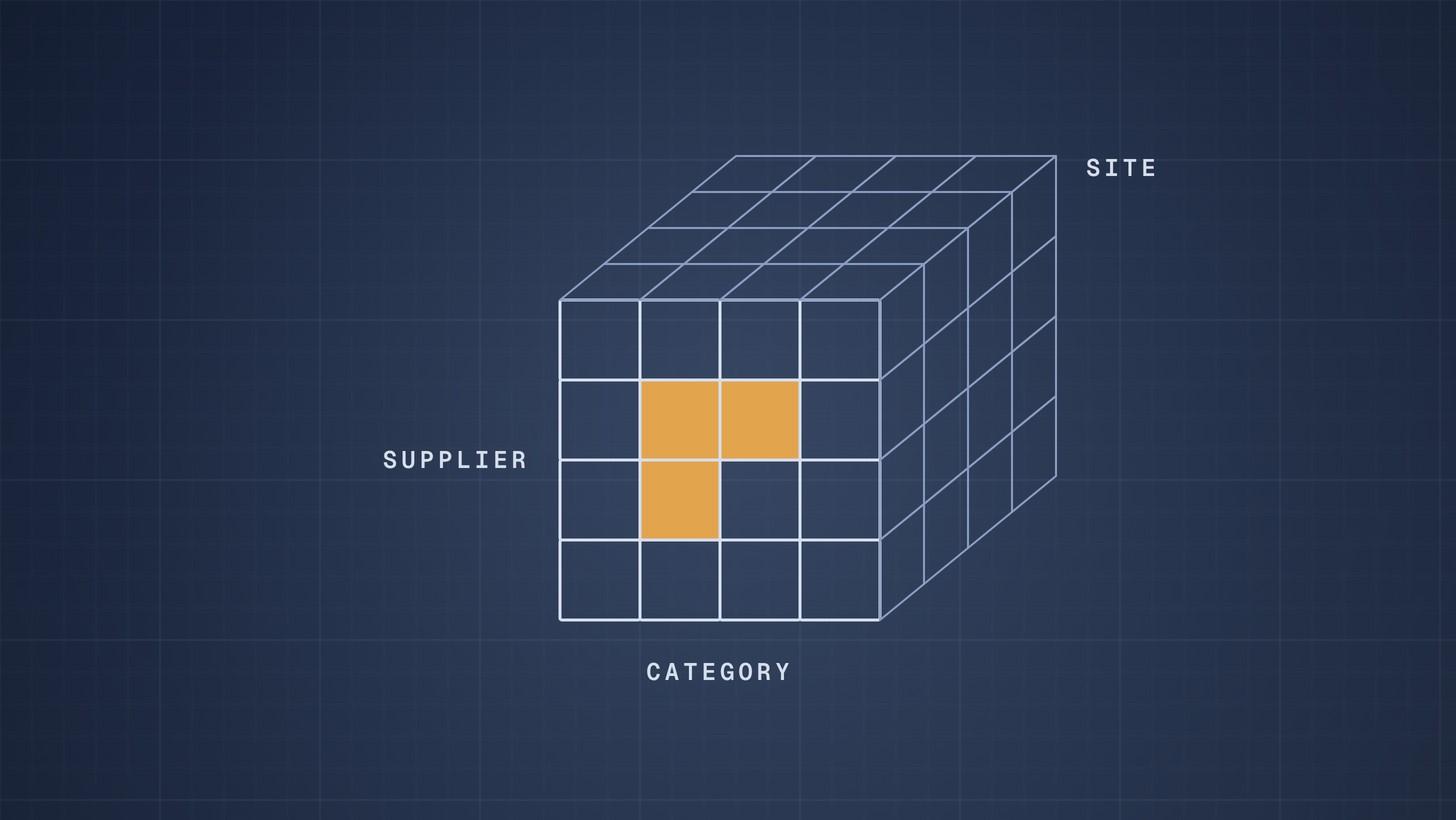
A spend analysis for engineered equipment collects every purchase order and invoice for pumps, valves, instruments, vessels and packages, cleans the supplier names and descriptions, classifies each line by category, and then slices the result by supplier, site, project and time. The output, often called a spend cube, shows where your money goes, how fragmented it is, and where a framework, a standard range or a tougher negotiation will pay. The template below gives you the columns to start with.
Why this matters now
Engineered equipment spend is usually scattered. Capital projects buy through EPC contractors, maintenance buys replacements through the stores system, and each site has its favourite suppliers. Few organisations can answer simple questions: how much did we spend on centrifugal pumps last year, with how many makers, at what unit prices?
The scale of the problem can be large. One chemicals manufacturer described by Emerson had more than 45,000 valve products in its ERP system and more than 6,000 active suppliers, with valves and controls taking 40% of operating expenditure [1]. You cannot standardise, consolidate or negotiate what you cannot see.
Create and manage RFQs in minutes
ChemCapital handles the entire procurement cycle, from structured RFQs and supplier comparisons to formal purchase orders and delivery tracking.
What a spend analysis is
The CIPS and NIGP public procurement standard defines spend analysis as "the process of collecting, cleansing, classifying and analyzing expenditure data from all sources", covering current, past and forecast spend by supplier, commodity and department [2]. The questions it should answer are basic ones: what was bought, when, where, from how many suppliers, at what total cost and at what unit price [2].
The "cube" is a way of picturing it: spend on one axis by category, on another by supplier, on a third by site or project, with time as the slicer. Each cell holds a total you can drill into.
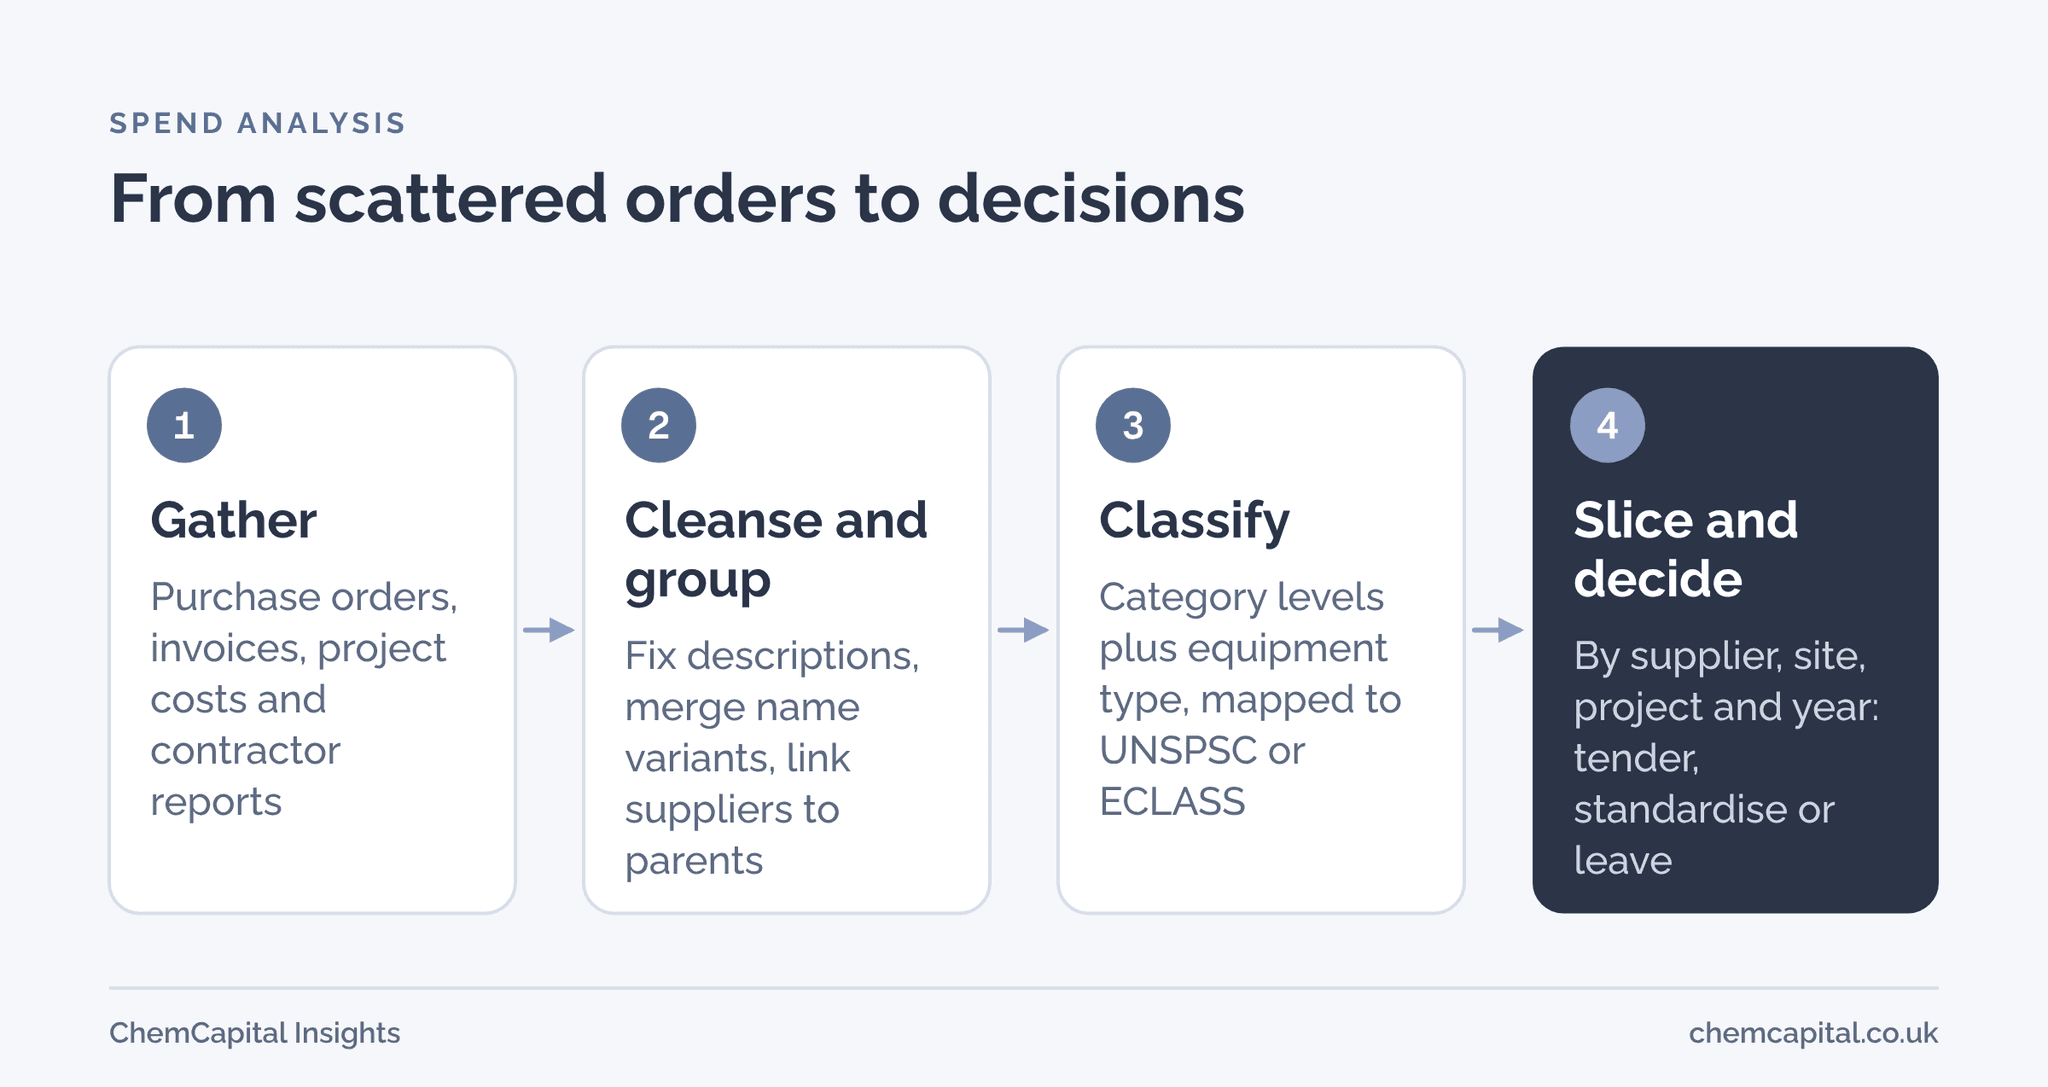
Step by step
- Find the sources. Accounts payable data is the minimum [2]. For engineered equipment, add the purchasing system, project cost systems and the EPC contractor's procurement reports, because much capital spend never passes through your own purchase orders. Jaggaer's guide stresses looking beyond purchasing for data held in other systems [3].
- Gather it in one place. One table, one currency, one date format. Convert currencies at a stated rate.
- Cleanse it. Remove duplicates and errors [2]. Standardise units and descriptions. For equipment, the description is often the weakest field; Emerson notes that accurate and complete item descriptions are key to reducing cost [1].
- Group suppliers by parent. Link name variants and subsidiaries to one parent, so you get a true supplier count and see your real volume with each group [3].
- Classify. Map each line to a taxonomy. Standard schemes such as UNSPSC or ECLASS work, as do company categories [3]. UNSPSC is a numeric hierarchy of four levels, segment, family, class and commodity, each a pair of digits [4]. ECLASS also has four levels with an eight digit code, and adds properties and values that describe each product, which suits technical items such as pumps and valves [5]. For engineered equipment, add a level below the standard one, such as pump type or valve type, because that is where the decisions are made.
- Analyse. Slice by category, supplier, site, project and year. Look at concentration, unit prices and contract coverage.
- Repeat. A one off analysis is a good start; refreshing it regularly shows contract compliance and new opportunities [3]. The CIPS and NIGP standard recommends regular, automated reports [2].
Template: the columns to collect
| Column | Example | Why it matters |
|---|---|---|
| Source and reference | PO 4500123, invoice 88712 | Traceability back to the record |
| Date | 14 March 2026 | Trends and price comparisons over time |
| Supplier (as recorded) | Acme Pumps UK Ltd | Raw value, kept for audit |
| Supplier (cleaned) | Acme Pumps | Groups name variants |
| Parent group | Acme Group | True volume per supplier group |
| Category level 1 | Rotating equipment | Category strategy |
| Category level 2 | Pumps | Category strategy |
| Equipment type | End suction centrifugal | Standardisation and unit price |
| Standard code | UNSPSC class or commodity | Comparability with other data |
| Site | Site B | Site by site comparison |
| Spend type | Capital project, maintenance, spares | Different buyers and budgets |
| Project or cost code | Project 2207 | Capital spend by project |
| Item description | 50 kW end suction pump, 316 stainless steel | Specification and duplicates |
| Quantity and unit | 2 each | Unit price |
| Net value in GBP | £38,400 | Totals |
| Contract or framework | Yes or no | Contract coverage |
Keep the raw columns alongside the cleaned ones, so anyone can check how a line was classified. If one column will be weak, make it the equipment type, then improve it category by category.
What to look for
Fragmentation. Many suppliers for one category, each with a few orders. The CIPS and NIGP standard lists duplicate suppliers among the things a spend analysis should reveal [2].
Unit price spread. The same equipment type bought at very different prices across sites or years. Normalise for size and material before you compare.
Contract coverage. The share of category spend placed under a framework or agreed price list, and who buys outside it.
Spares and service. Spares bought from the original maker without competition, at list price. These are often a large share of maintenance spend and easy to tender for common parts.
Expediting and urgency. Air freight, expediting fees and rush orders signal poor planning or weak supplier performance; the standard flags expediting costs and excess inventory as findings too [2].
Specification creep. Many variants of what should be one standard item. That points to an engineering standard, not just a commercial deal.
Practical example
Illustrative figures. A company with three sites analyses two years of engineered equipment spend, £2,400,000 in total. Cleaning reduces 212 recorded supplier names to 131 suppliers, merging 81 duplicates and subsidiaries.
| Category | Spend | Share | Suppliers | Spend per supplier |
|---|---|---|---|---|
| Valves | £620,000 | 25.8% | 46 | £13,478 |
| Pumps | £540,000 | 22.5% | 19 | £28,421 |
| Vessels and tanks | £450,000 | 18.8% | 6 | £75,000 |
| Instruments | £410,000 | 17.1% | 33 | £12,424 |
| Heat exchangers | £380,000 | 15.8% | 7 | £54,286 |
| Total | £2,400,000 | 100% |
Valves and instruments stand out: a quarter of the spend spread over 46 suppliers, and another sixth over 33, each with small volumes. Those are framework candidates, as our article on category strategy for engineered equipment explains. Vessels and heat exchangers are bought from few suppliers because each order is engineered to order; there, the opportunity lies in better competition at project level, not consolidation.
Who should be involved
A spend analysis done by procurement alone tends to stall at classification, because buyers cannot always tell a sanitary diaphragm valve from a general service one from a cryptic description. Bring in an engineer for each major category to check the equipment types, and a maintenance planner who knows which spares are bought where. Finance can reconcile totals with the ledger, which gives the result credibility. The CIPS and NIGP standard recommends a multiskilled team where other functions hold the data [2].
Agree the scope and the taxonomy before the cleaning starts. Two years of data is usually enough to see patterns without drowning in legacy codes. If the analysis is for a specific decision, such as a valve framework, start with that category and expand later.
Turning findings into a plan
Rank every opportunity on two scales: the value at stake and how easy it is to capture. A category with large, fragmented spend and simple, standard items, such as general service valves, scores high on both and goes first. A category with high value but bespoke designs, such as reactors, needs a different approach: better competition and specification on each project rather than a framework.
For each opportunity, write one line: the decision, the owner and the date. Typical decisions are:
- Tender a framework for repetitive categories with many small suppliers.
- Standardise where many variants serve the same duty, starting with an engineering standard.
- Renegotiate with suppliers where you hold more volume than you realised once subsidiaries are grouped.
- Leave alone where spend is small or already well managed.
Then repeat the analysis in a year and check whether the decisions changed the numbers.
Common mistakes
- Analysing purchase orders only, and missing the capital spend placed through EPC contractors.
- Over engineering the taxonomy before the data is clean. Start with two levels, then add equipment type for the big categories.
- Treating it as a one off. A spend analysis that is not refreshed is out of date within a year.
- Presenting totals without actions. Every finding should end in a decision: tender, standardise, consolidate or leave alone.
- Ignoring supplier performance. Combine spend with on time delivery and quality, as in a supplier scorecard, so you do not consolidate onto a weak supplier.
Where ChemCapital fits
Spend analysis is easier when the data is captured cleanly at the point of purchase. ChemCapital's spend dashboard, available on company plans, tracks committed spend by category, supplier, project and site from the purchase orders you issue, and project costing keeps capital spend tied to the project that incurred it.
Ready to see where your equipment spend goes? Start a free 14 day ChemCapital trial, with no credit card needed.
Frequently asked questions
What is a spend cube?
A way of organising spend data by category, supplier and site or project, with time as a slicer, so you can see totals in each combination and drill into them.
What data do I need for a spend analysis?
Accounts payable data as a minimum, plus purchase orders, project cost data and contractor procurement reports for capital spend, with supplier, date, description, quantity, value, site and project.
How do I classify engineered equipment spend?
Use a standard scheme such as UNSPSC or ECLASS, or your own categories, and add an equipment type level below it, such as pump or valve type, because that is where standardisation decisions are made.
How often should I refresh a spend analysis?
Regularly, ideally with automated monthly or quarterly reports, so contract compliance and new opportunities stay visible.
Informational only, not procurement or legal advice. Cited names, frameworks, and statistics belong to their respective owners.
Create and manage RFQs in minutes
ChemCapital handles the entire procurement cycle, from structured RFQs and supplier comparisons to formal purchase orders and delivery tracking.
Start for freeRelated articles
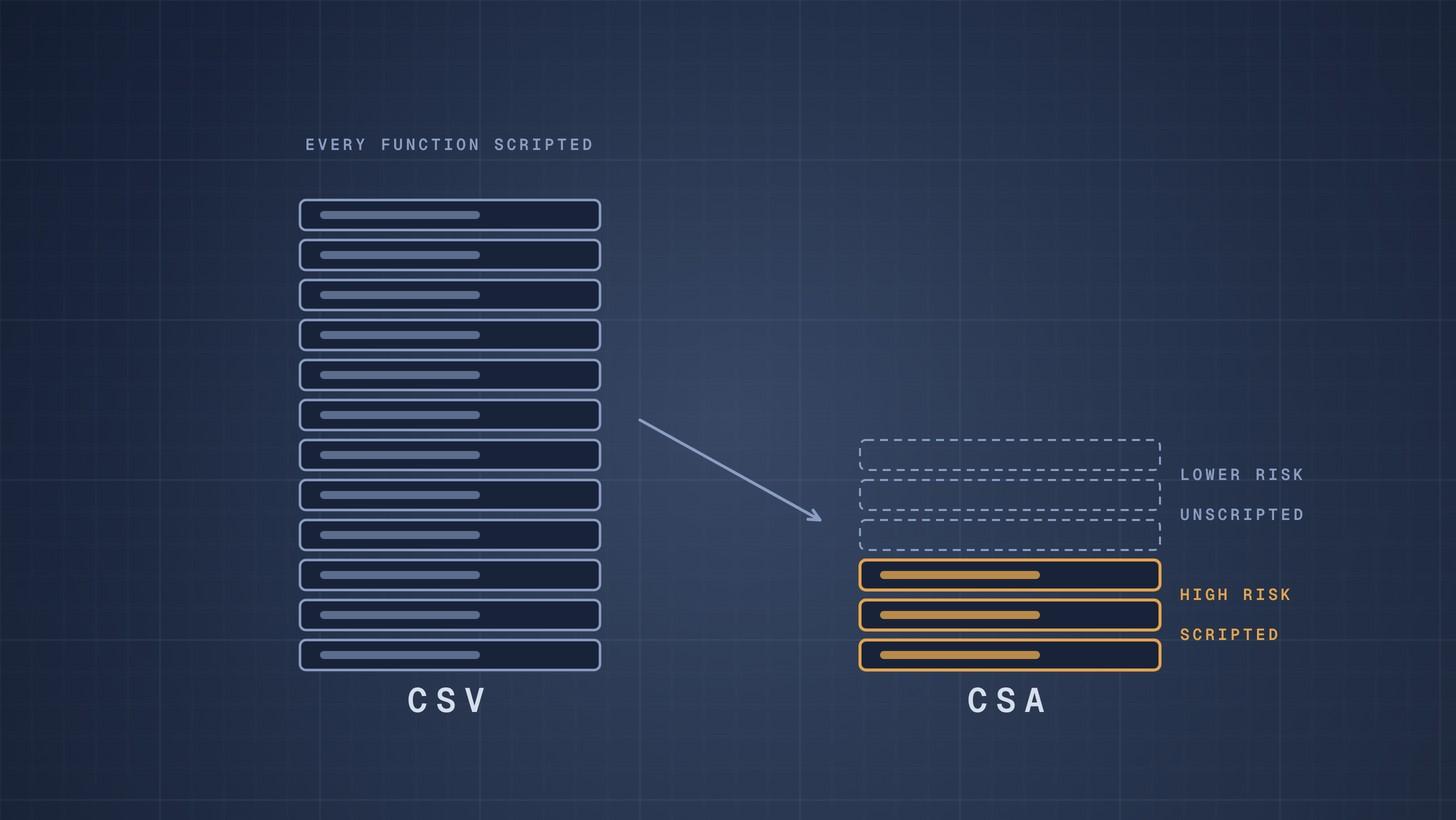
CSV vs CSA: Computer Software Assurance for Equipment Buyers
FDA finalised its computer software assurance guidance in 2025 and updated it in 2026. Here is what changes from classic CSV, where it applies, and what to ask equipment suppliers.
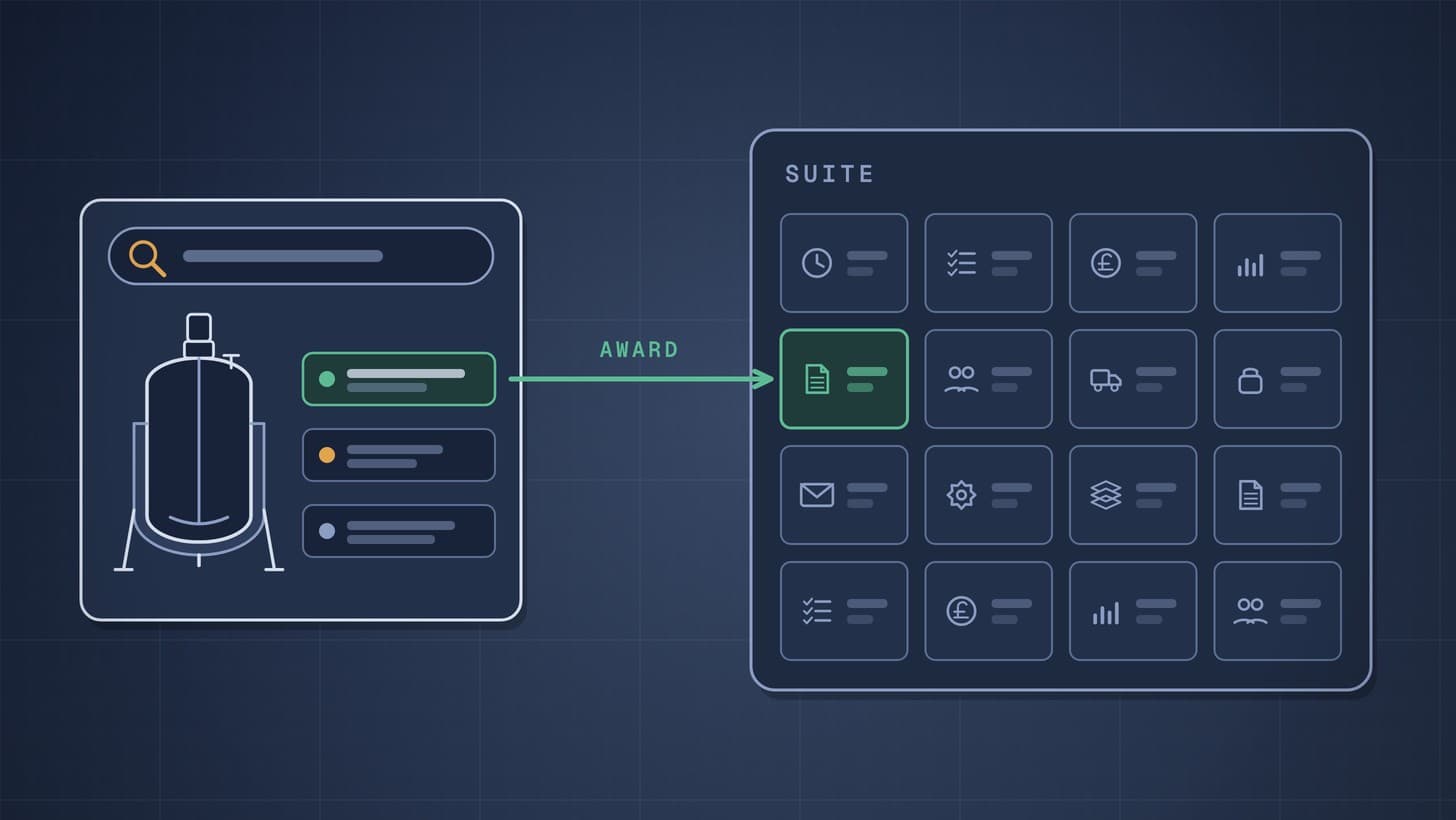
Coupa or SAP Ariba Supplier Discovery vs a Specialist Tool: When to Use Each
Coupa and SAP Ariba run sourcing well. For engineered equipment, here is where a specialist supplier search tool helps, how it works alongside the suite, and a decision table.
EU GMP Annex 11 and Its Revision: What Equipment Buyers Should Ask For
What Annex 11 already requires when you buy equipment with software, what the 2025 draft revision adds on suppliers, access, audit trails and security, and the questions to put in every RFQ.