
Cost Risk Analysis: P50, P80 and P90 Estimates with a Worked Example
What P50, P80 and P90 mean, how range estimating and Monte Carlo simulation produce them, a worked three item example, and how owners choose a funding level.
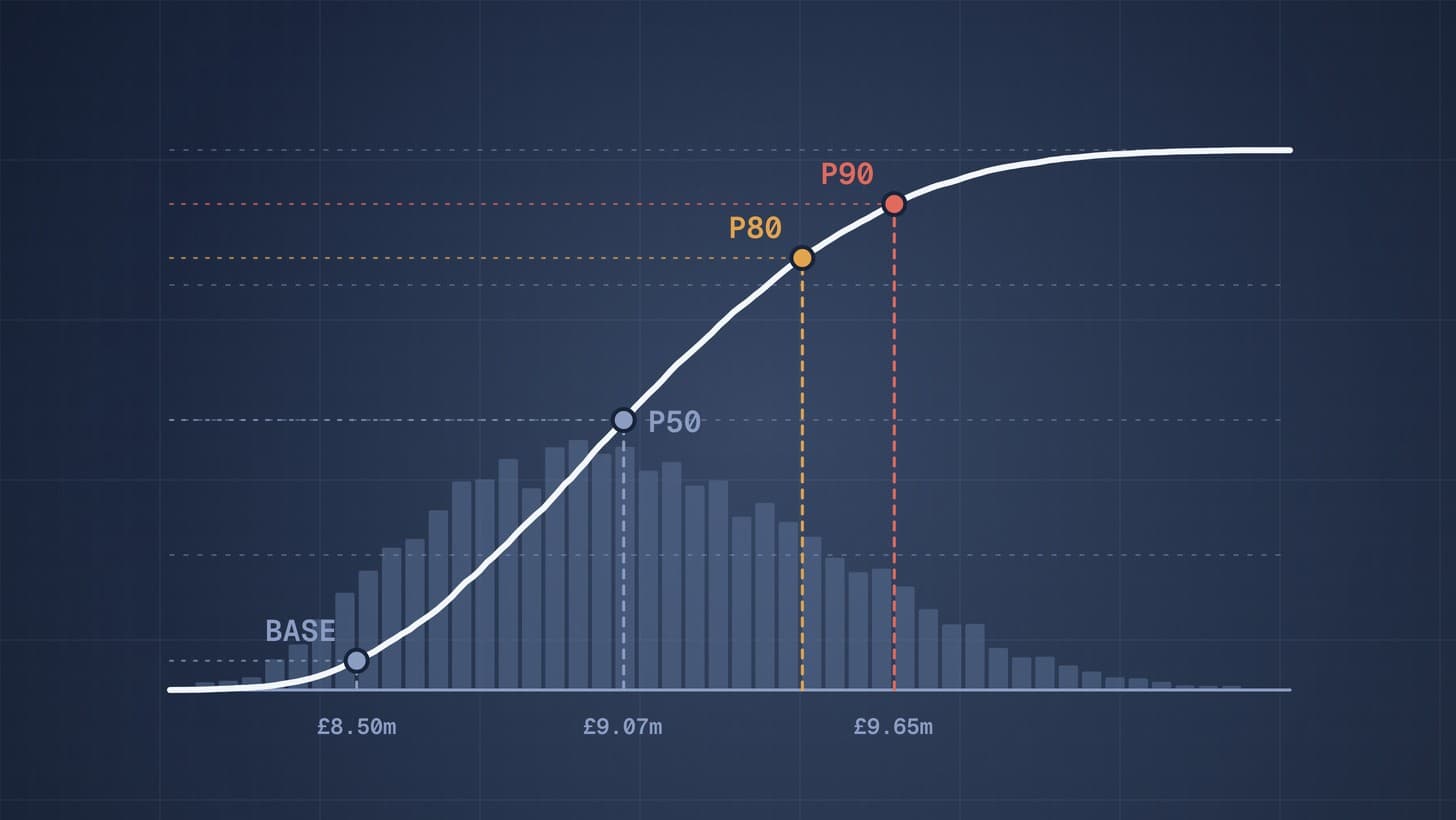
P50, P80 and P90 are confidence levels on a cost estimate. P50 is the cost with a 50% chance of not being exceeded; P80 has an 80% chance and P90 a 90% chance, so each step up carries more contingency [1]. They come from a quantitative cost risk analysis, usually range estimating with Monte Carlo simulation: each uncertain item gets a range, a computer adds up thousands of random combinations, and the results are read off at each percentile. Owners then choose which level to fund.
This article builds on our guide to contingency in capital cost estimates, which covers why contingency exists and how it is used. Here the focus is on where the P numbers come from and how to read them.
Why this matters now
Public funders now ask for P values explicitly. Projects seeking Australian Government infrastructure funding must present both a P50 and a P90 estimate, and those above $25 million must use a probabilistic process rather than a deterministic one [1]. Australia's Department of Finance uses P50 at first stage approval and P80 at second stage approval for capital works [2]. In the UK, the Infrastructure and Projects Authority's guidance, updated in January 2026, places the median, P50, value of risk in the anticipated final cost, while warning that probabilistic methods can give false confidence when the input data is immature [3]. Private owners are adopting the same language, and suppliers' budget quotes feed directly into it.
Join ChemCapital to streamline sourcing and connect with verified partners
Whether you're buying or supplying, ChemCapital gives you the tools to manage the complete procurement cycle in one platform.
What the P values mean
A P value is a point on a cumulative probability curve, the S curve, that shows the chance of the final cost being at or below each value. Two common misreadings are worth avoiding:
- P50 is not "the estimate plus a bit". It is the median of the simulated outcomes, and it can sit well above a single point base estimate if the risks are skewed upwards.
- P90 is not a ceiling. One project in ten should still come in above it.
Australia's Department of Finance puts it simply: P80 is a cost that will not be exceeded 80% of the time [2].
How range estimating works
AACE's Recommended Practice 41R 08 describes range estimating, which combines Monte Carlo sampling with a focus on a small number of critical items [4]. The main steps are:
- Find the critical items. These are the items whose plausible variation could move the total by more than a set threshold. The practice notes there are typically only 10 to 20 of them, and that size alone does not make an item critical [4].
- Assign ranges. For each critical item, the team sets a minimum, most likely and maximum value, wide enough to capture realistic extremes, and keeps non critical items as a fixed sum [4].
- Link related items. Items that move together, such as steel quantities and welding hours, should be linked, or the simulation will understate the spread.
- Simulate. The practice suggests about 1,000 iterations for reliable results [4]; modern tools easily run 10,000.
- Read the percentiles and set contingency as the difference between the value at the chosen confidence and the base estimate [4].
Where schedule drives cost, AACE's Recommended Practice 57R 09 goes further, simulating a resource loaded schedule to set cost and schedule contingency together for a chosen confidence of meeting both [5].
The quality of the ranges decides the quality of the answer. AACE's estimate classification shows how wide realistic ranges are at each stage, from minus 20% to 50% and plus 30% to 100% at Class 5 to much narrower bands later [6]; our article on AACE project costing explains the classes.
Practical example
In this illustrative example, a small plant estimate has three critical items, each given a triangular range in £ million:
| Item | Minimum | Most likely (base) | Maximum |
|---|---|---|---|
| Equipment | 3.8 | 4.0 | 4.8 |
| Installation, bulks and labour | 2.7 | 3.0 | 4.2 |
| Engineering and management | 1.4 | 1.5 | 1.9 |
| Total | 8.5 |
A Monte Carlo simulation with 10,000 iterations, treating the items as independent, gives:
| Result | Value | Contingency over base |
|---|---|---|
| P10 | £8.59m | |
| P50 | £9.07m | £0.57m, about 7% |
| P80 | £9.45m | £0.95m, about 11% |
| P90 | £9.65m | £1.15m, about 14% |
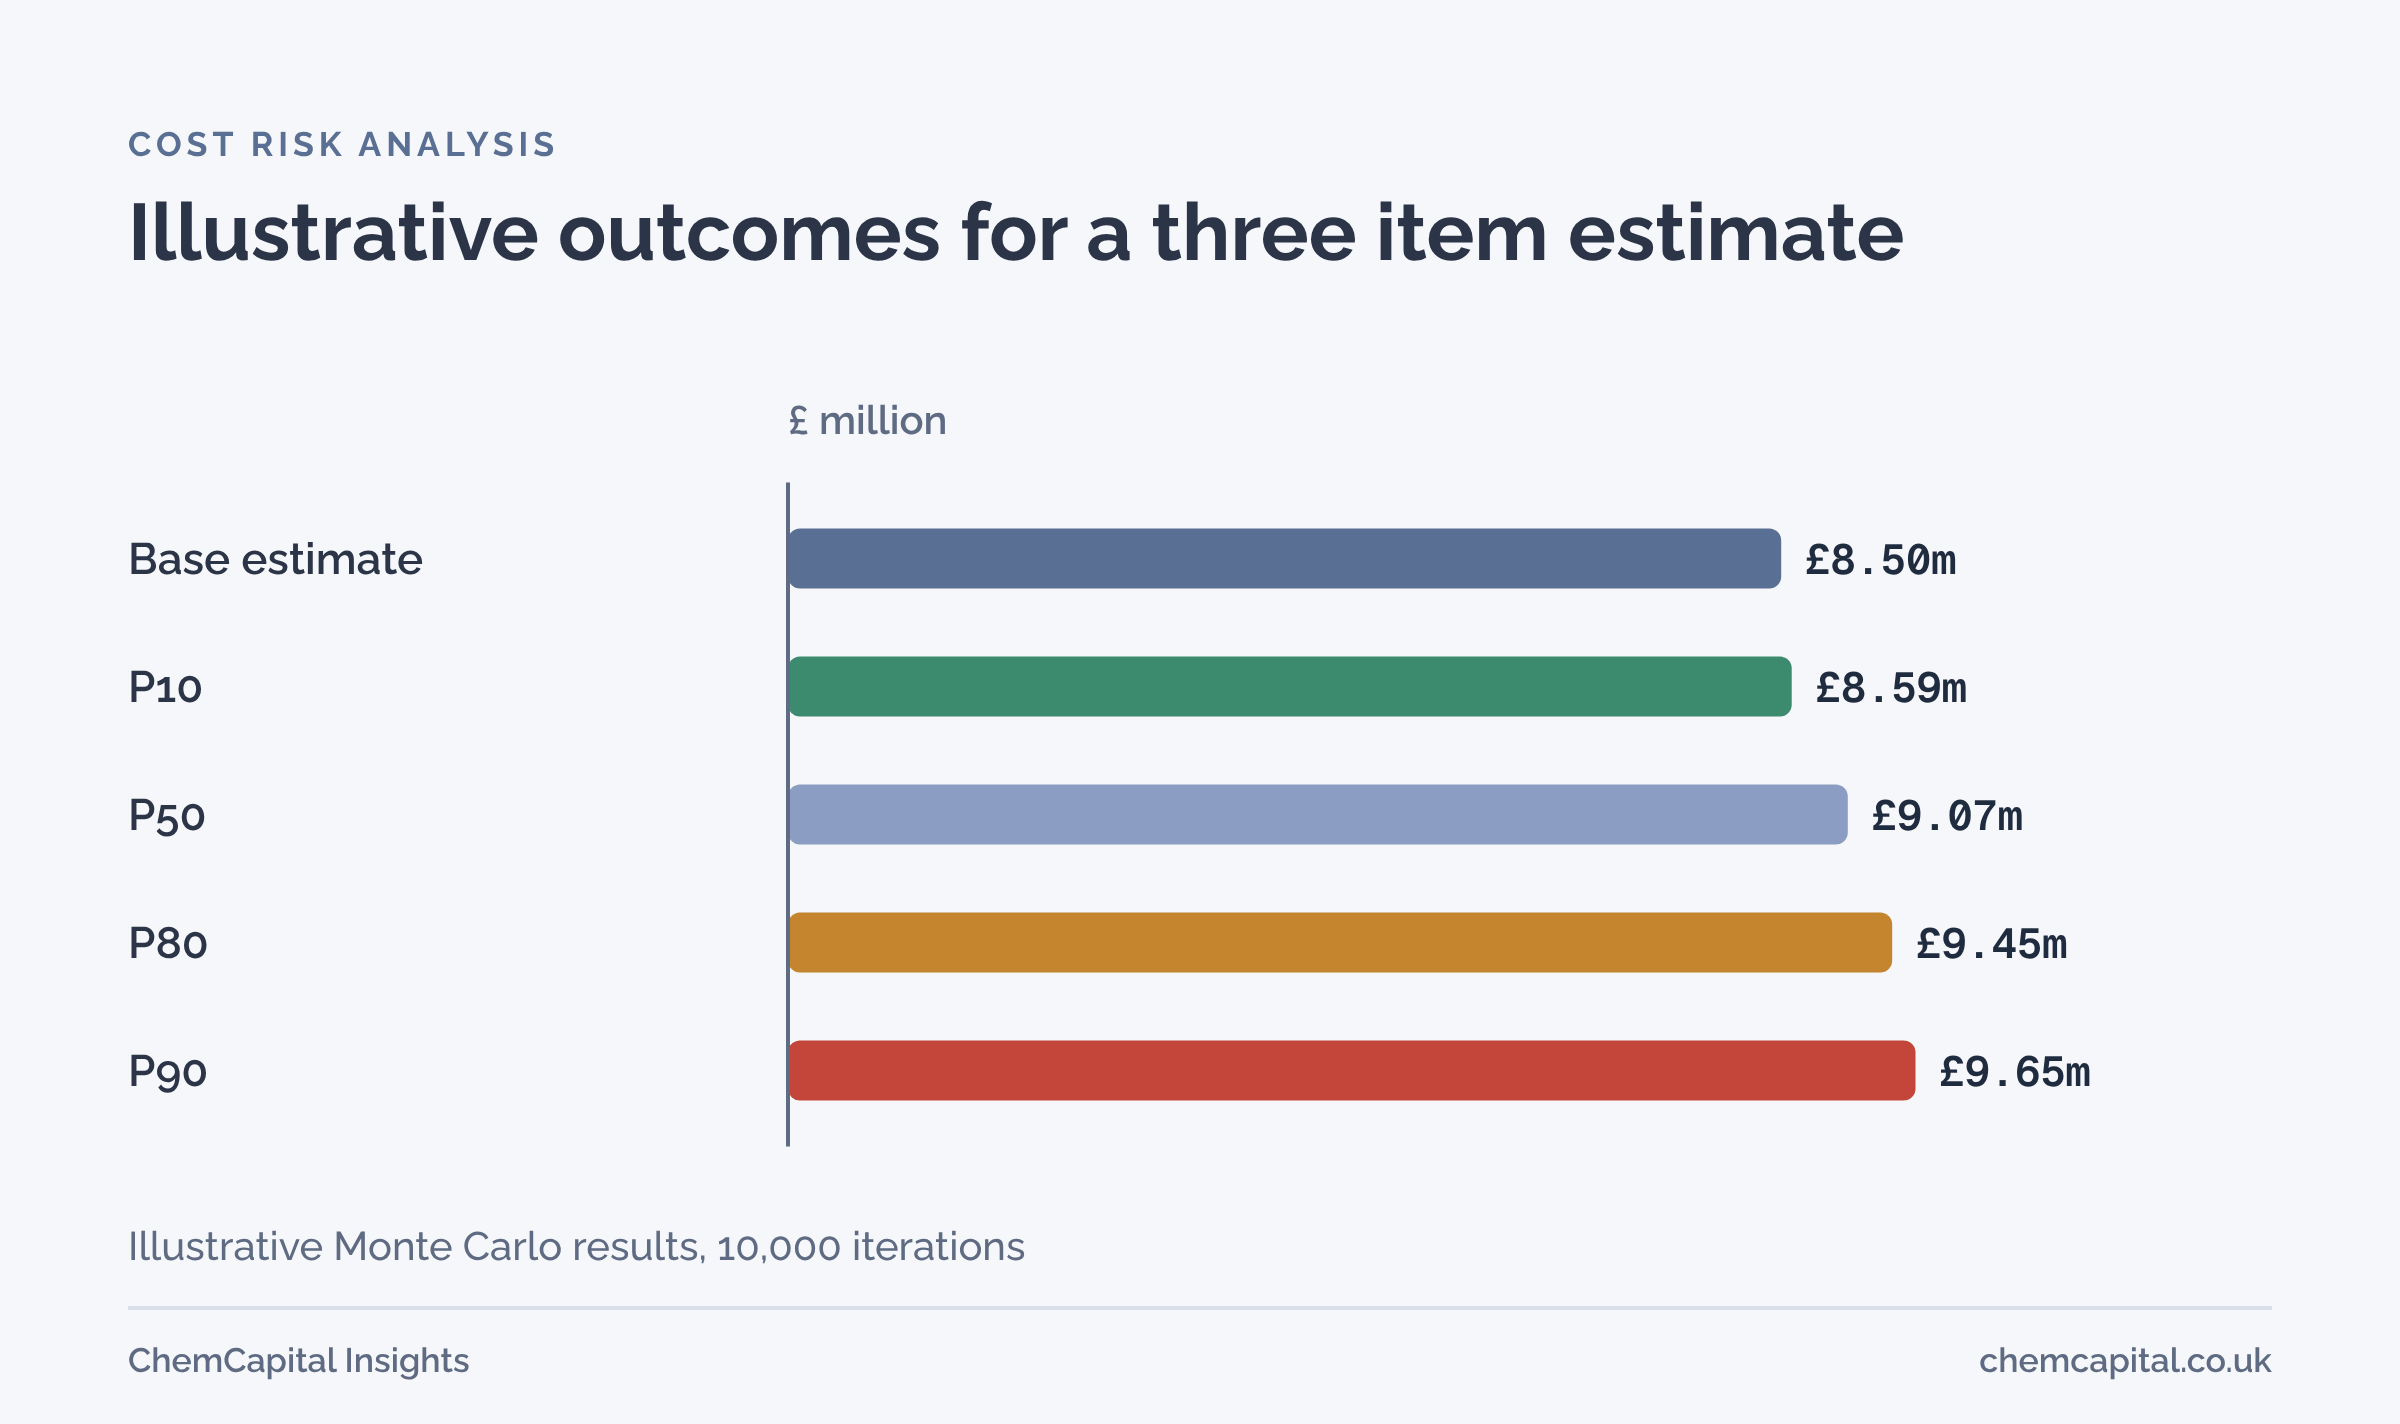
Three things stand out. First, the base estimate of £8.5 million built from most likely values has only about a 5% chance of not being exceeded, because every range is skewed upwards. Second, the P50 sits about £0.57 million above the base, which is the contingency needed just to have even odds. Third, correlation matters: if the three items moved fully together, the simulated P90 would rise to about £10.07 million, so linking related items is not a detail.
Common pitfalls
- Ranges that are too narrow. Teams anchor on the base estimate and set ranges of a few percent either side. Ask for the realistic worst case first, then the best case.
- Ranging everything. Putting ranges on hundreds of small items adds noise and hides the few that matter. Focus on the critical items.
- Ignoring links between items. Independent sampling of items that really move together understates P80 and P90, as the example above shows.
- Treating the output as precise. A P90 of £9.65 million is an estimate built on judgement, not a measurement. Round it, and state the assumptions behind it.
- Running it once. Repeat the analysis at each stage gate as quotes replace estimates; the curve should tighten as evidence improves.
Choosing the funding level
AACE's range estimating practice describes a 50% target as risk neutral and 80% or more as conservative, noting that higher targets tie up more funds [4]. In practice, owners choose based on:
- Tolerance for overrun. A single critical project often justifies P80 or P90; a portfolio of many projects can be funded nearer P50, because overruns and underruns partly cancel.
- Who holds the difference. Many owners approve at P50 for the project team and hold the gap to P80 or P90 as a reserve controlled at a higher level.
- Maturity of the data. The IPA warns that probabilistic results can mislead on low maturity data [3], so early estimates need wide ranges and honest caveats.
- Releasing contingency. As risks pass, contingency should be reviewed and released, not quietly spent [4].
Where ChemCapital fits
ChemCapital's Project Costing gives a risk analysis better inputs. Estimates are built from past supplier quotes in a reusable library, repriced through a deterministic normalisation with every adjustment shown, and each workspace shows a cost range with contingency linked to the project's maturity stage, tightening as evidence improves. The dashboard separates firm quotes, repriced estimates, indicative values and items not yet quoted, which is exactly the split you need to decide which items deserve the widest ranges.
Ready to see what your estimate rests on before you run the risk analysis? Start free with ChemCapital.
Frequently asked questions
What does P50 mean in a cost estimate?
P50 is the cost with a 50% chance of not being exceeded, so the final cost is equally likely to come in above or below it. P80 and P90 are the costs with an 80% and 90% chance of not being exceeded, and so carry more contingency.
How are P50 and P90 estimates calculated?
Usually by quantitative risk analysis: the estimator assigns a range to each uncertain item and runs a Monte Carlo simulation, which adds up thousands of random combinations and reports the cost at each percentile. AACE's range estimating practice describes this method.
Should a project be funded at P50 or P90?
It depends on the owner's tolerance for overrun and the cost of tying up money. A P50 budget will be exceeded about half the time; a P90 budget rarely, but it locks up more contingency. Many owners approve at one level and hold the difference as a managed reserve.
Informational only, not procurement or legal advice. Cited names, frameworks, and statistics belong to their respective owners.
Join ChemCapital to streamline sourcing and connect with verified partners
Whether you're buying or supplying, ChemCapital gives you the tools to manage the complete procurement cycle in one platform.
Get started freeRelated articles

Equipment Cost Estimating: How to Get Budget Prices for Exchangers, Vessels and Pumps
Five ways to get budget prices before firm quotes, how accurate each can be by estimate class, what drives the price of each equipment type, and a worked example.
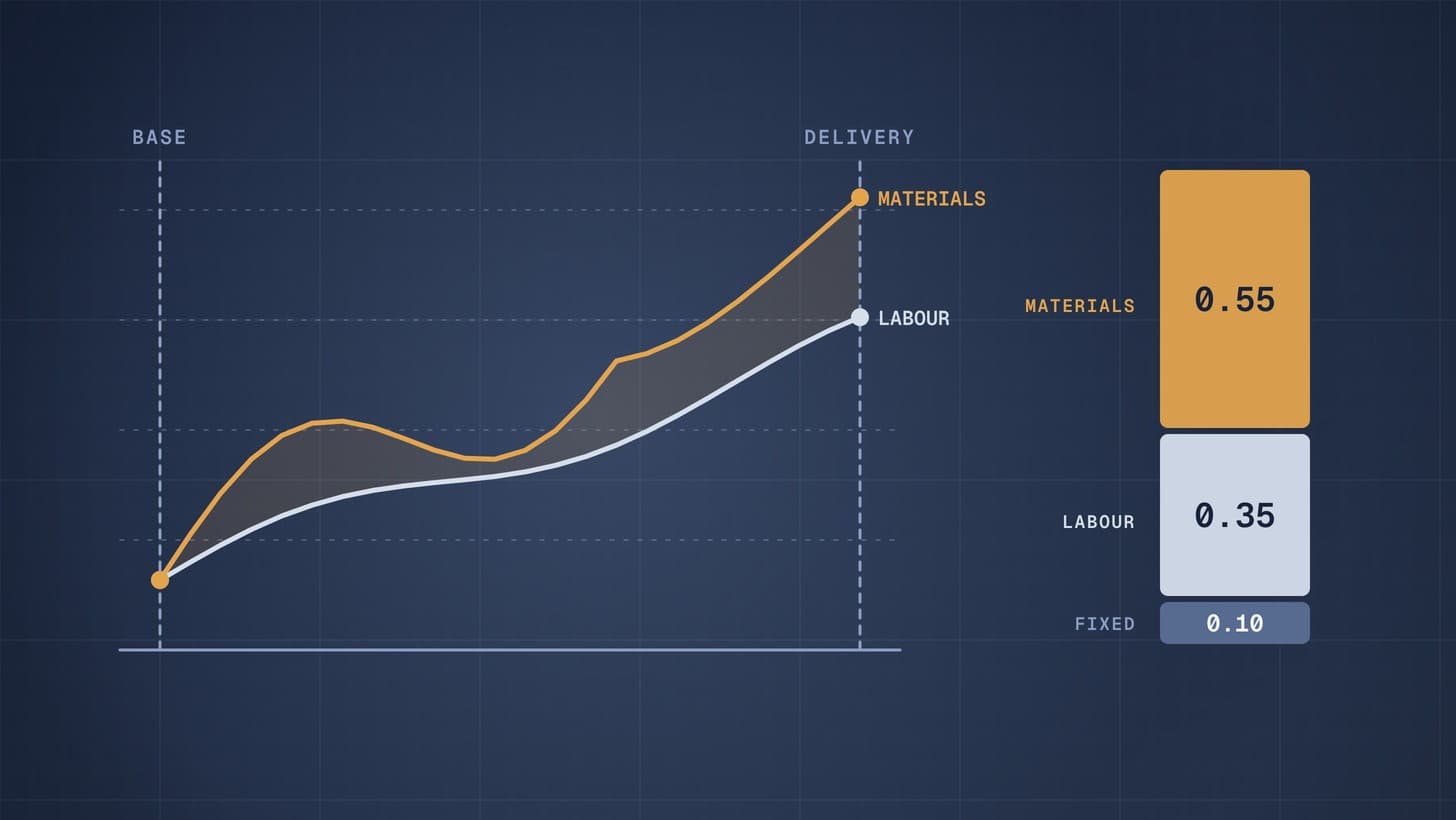
Price Adjustment, Escalation and Currency Clauses in Equipment Quotes
Why long lead equipment quotes carry escalation and alloy surcharge clauses, how the standard index formula works, what to agree, and how to compare a fixed and an adjustable bid.
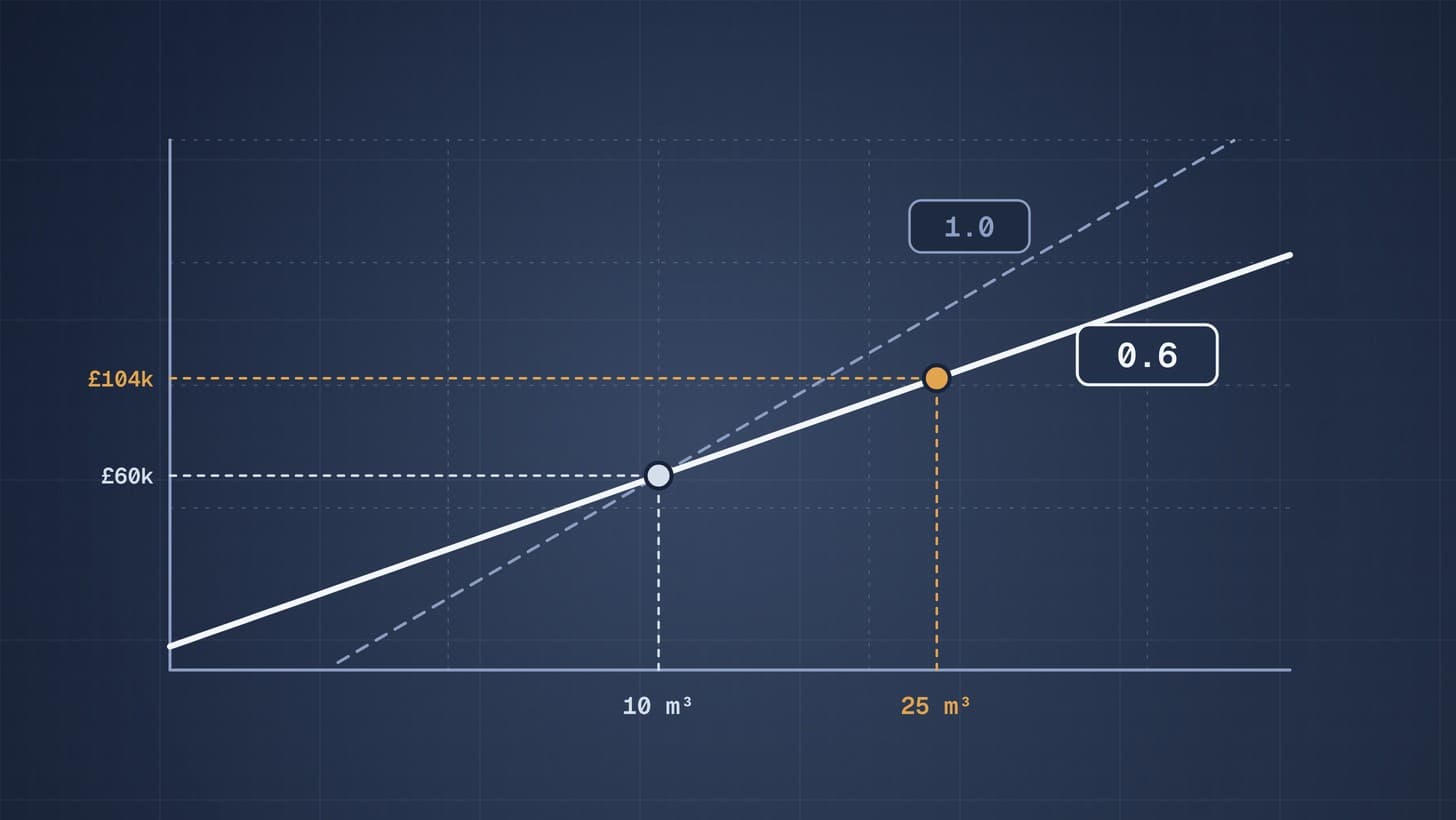
The Six Tenths Rule: Scaling Equipment Costs, with Worked Examples
How to scale a known equipment price to a new capacity with the six tenths rule, better exponents by equipment type, and how to bring an old quote up to date.