
How to Read a Pump Curve and Compare Two Bidders' Curves
How to read a centrifugal pump curve: head, efficiency, BEP, power, NPSHr and the system curve, then how to compare two bids for one duty, with a worked energy cost example.
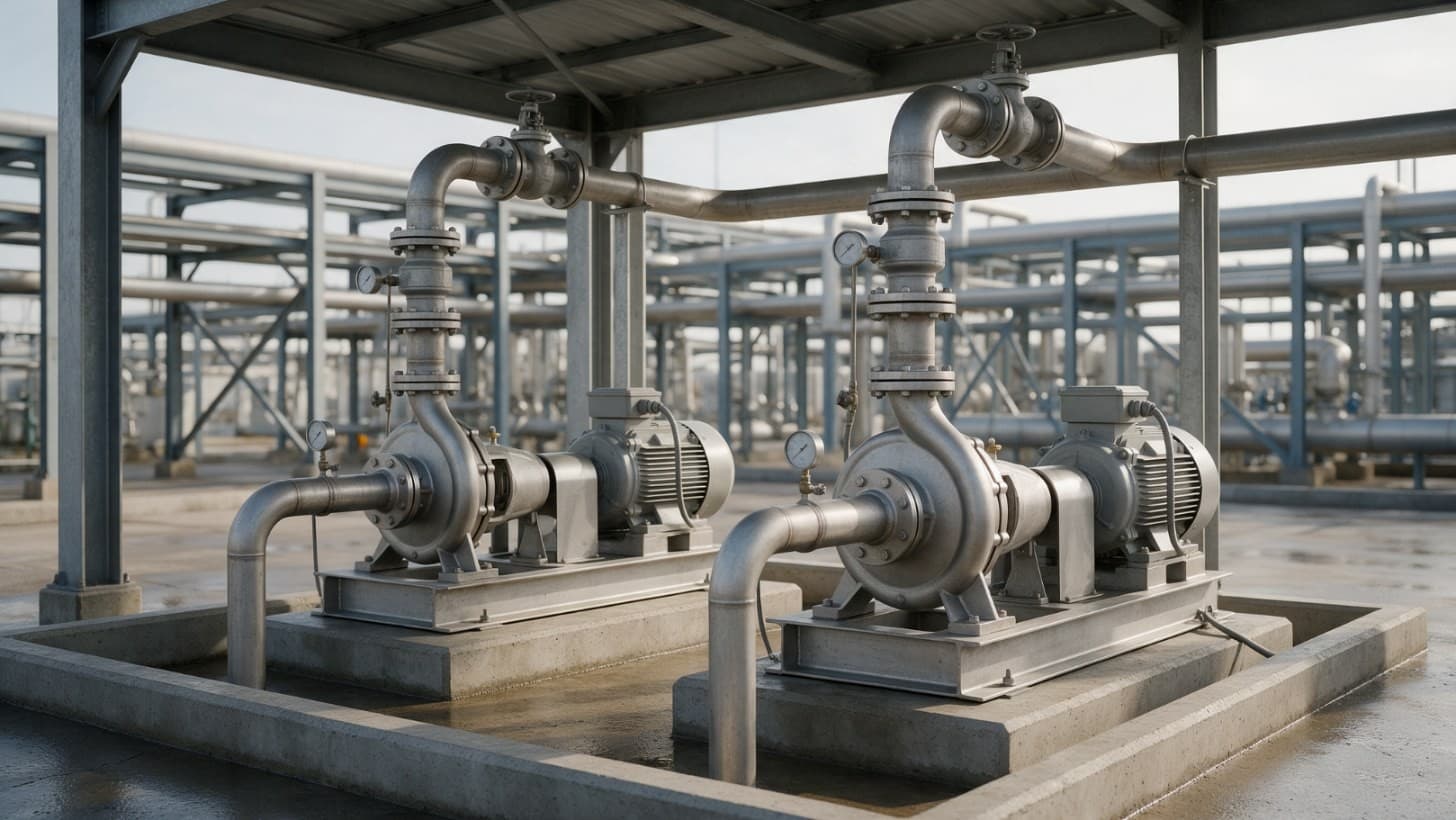
A pump curve shows what a centrifugal pump will do at one speed and one impeller diameter. Head falls as flow rises, and the efficiency, power and NPSHr (net positive suction head required) lines share the same flow axis. The pump runs where its head curve crosses your system curve, and that point should sit close to the best efficiency point, or BEP [1, 2].
To compare two bidders for one duty, read both curves at the same flow and work through the checks in the table below.
Why this matters now
Energy is often one of the largest costs of owning a pump, and can dominate it. A 2001 life cycle cost guide from the Hydraulic Institute (HI), Europump and the US Department of Energy (DOE) also puts pumping systems at nearly 20% of the world's electricity demand [3]. A few points of efficiency at duty are easy to miss on a datasheet, yet can outweigh the price gap between bids.
Pumps are also often bought too big, through rounding up, allowing for pipes that roughen over time, and planning for expansion [4]. An oversized pump runs far from its BEP or is throttled by a valve, and both waste energy [4].
Create and manage RFQs in minutes
ChemCapital handles the entire procurement cycle, from structured RFQs and supplier comparisons to formal purchase orders and delivery tracking.
The lines on a pump curve
Head against flow. Head is the energy the pump adds, in metres of the liquid pumped, so the curve does not depend on density [1]. The left end is shut off, at zero flow; HI warns that even a brief run there can do serious mechanical damage. The right end is runout, where the pump may cavitate and vibrate, and some pumps overload their driver [1].
Efficiency and BEP. Efficiency is hydraulic power delivered divided by shaft power taken; the flow where it peaks is the BEP, where vibration and noise are also low [1]. Iso efficiency lines join points of equal efficiency. Together with the largest and smallest impeller curves, the highest ones enclose a rounded area Xylem calls the efficiency island, where the pump runs near its best [5]. Around the BEP lies the preferred operating region (POR); beyond it, the manufacturer sets a wider allowable operating region (AOR) from limits such as cavitation, heating and vibration [1].
Power. The shaft power line is used to size the motor [1]. Specific speed is a design number that reflects impeller shape. On a low specific speed pump, power rises with flow; on a high specific speed pump it peaks at zero flow [2, 6].
NPSHr. The suction head the pump needs at each flow. Grundfos advises knowing it at the largest flow and temperature you will run [2]. Our guide, NPSH explained, covers margins.
Impeller diameters and speed. Each speed and diameter has its own curve [1]. The affinity laws estimate a change: flow varies with diameter or speed, head with its square and power with its cube, if efficiency stays the same [1]. In practice a trimmed impeller loses some efficiency and usually needs more NPSH at a given flow [4]. The DOE advises against trimming below the minimum diameter on the curve, and limiting trims to about 75% of the maximum [4].
The system curve and the operating point
The system curve shows the head your plant needs at each flow: any static lift, plus friction losses that grow with flow [2, 3]. The pump settles where the curves cross, the operating point [2, 3]. If the real system needs less head than calculated, the pump runs further right, at higher flow and power.
On a flat curve, flow swings widely for a small shift in head; on a steep curve, flow moves much less [2]. A curve is unstable wherever head rises as flow rises, and KSB warns this can cause problems, for example in parallel operation [7]. For pumps sharing duty in parallel, ask for head that rises steadily back to shut off.
How to compare two bidders' curves for the same duty
First, check both curves are for the offered speed, impeller and liquid; a denser liquid than water needs more motor power [2]. Water curves ignore viscosity, which alters head, flow, efficiency, NPSHr and power, so ask for a corrected curve for viscous liquids [1].
| Check | What to read | What good looks like |
|---|---|---|
| Duty against BEP | Duty flow as a percentage of BEP flow | Inside the POR: from 90% to 110% up to 70% to 120% of BEP flow, depending on specific speed [1] |
| Efficiency at duty | Efficiency at duty flow, not at BEP | Turn any gap into kW and pounds |
| Allowable operating region | AOR stated by the bidder | Duty and end of curve inside it |
| Power and motor | Highest power on the offered curve | Motor rated above it |
| NPSH | NPSHr at duty and maximum flow | A clear margin below your NPSHa |
| Impeller headroom | Offered diameter against casing maximum | Room to grow if head was underestimated |
| Curve shape | Head from duty back to shut off | Rising steadily if pumps run in parallel |
| Test grade | ISO 9906 grade in the order | Tight enough to hold the efficiency you pay for |
Test tolerances
ISO 9906 tests one agreed guarantee point, not the whole curve; elsewhere you rely on the bidder's data unless you agree extra test points. KSB explains that the measured head curve must pass through a tolerance cross around that point [8]. Wilfley, a pump maker, publishes the six grade bands for pumps above 10 kW (smaller pumps get wider bands), and reports grade 2B as the default for chemical industry pumps under the 2011 edition of ANSI/HI 14.6, which was aligned with ISO 9906 [9]. Check the current edition before writing a grade into an order.
| Grade | Flow | Head | Efficiency |
|---|---|---|---|
| 1B | ±5% | ±3% | 3% below guarantee |
| 1E | ±5% | ±3% | No shortfall |
| 1U | 0% to +10% | 0% to +6% | No shortfall |
| 2B | ±8% | ±5% | 5% below guarantee |
| 2U | 0% to +16% | 0% to +10% | 5% below guarantee |
| 3B | ±9% | ±7% | 7% below guarantee |
The efficiency tolerance is a share of the guaranteed value, so 5% below 77% is 73.2%, not 72% [8].
Practical example
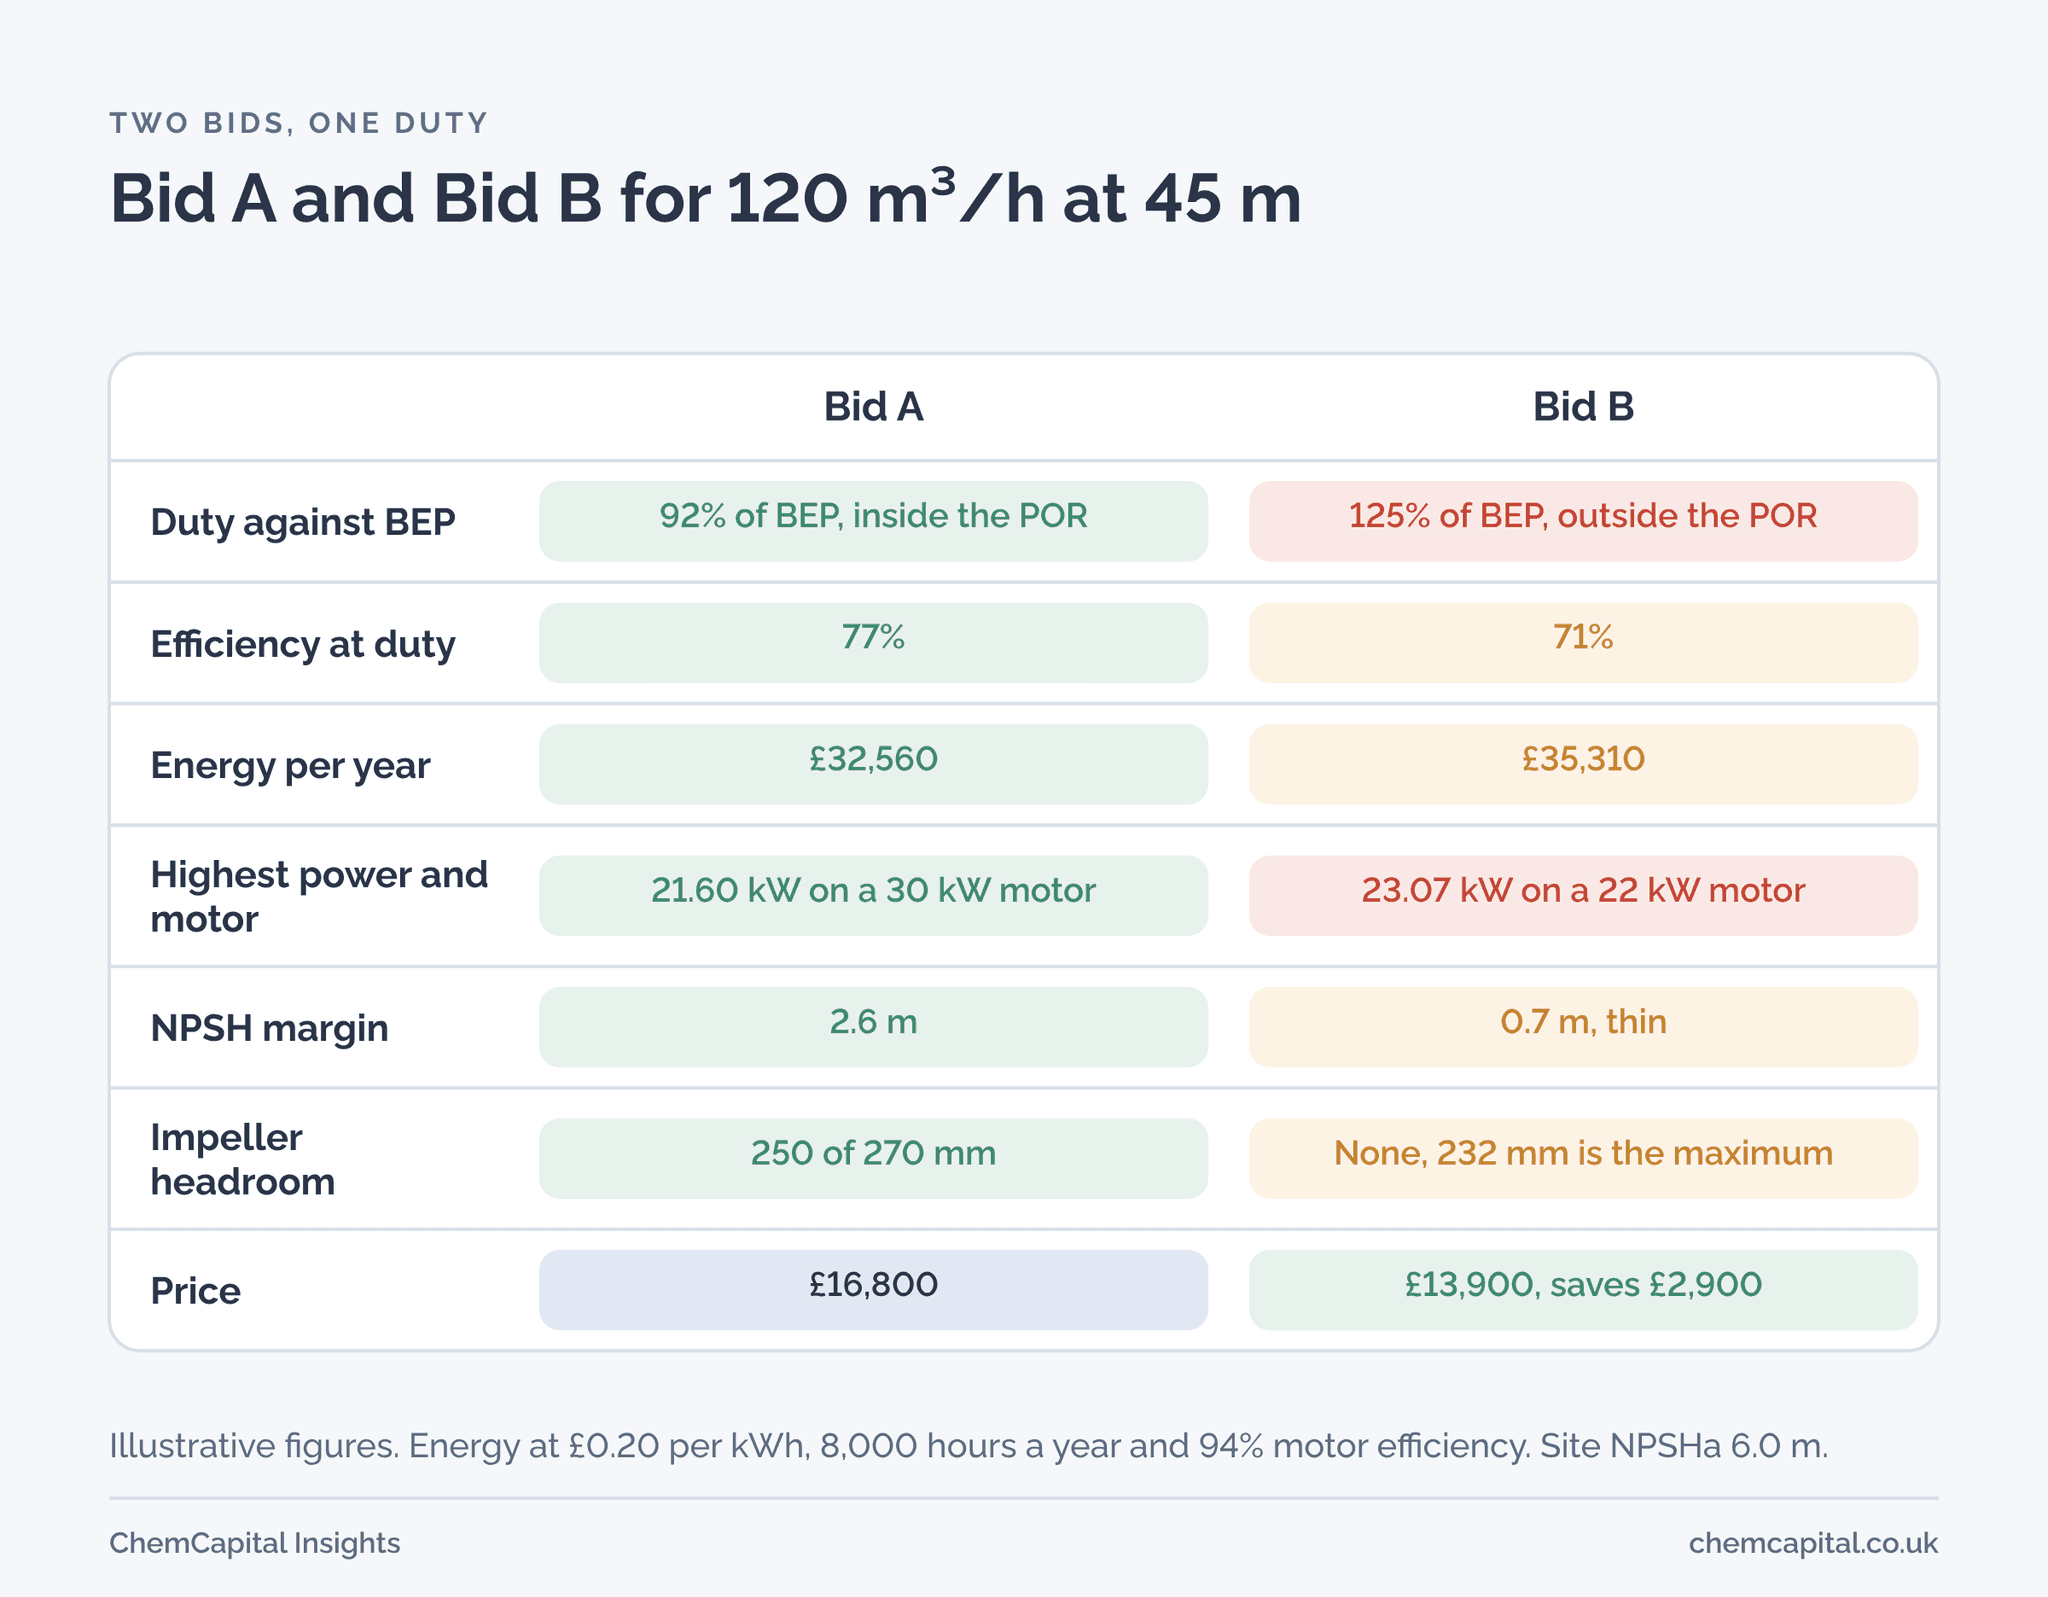
All figures are illustrative. A buyer needs 120 m³/h of water (specific gravity 1.0) at 45 m head for 8,000 hours a year, with NPSHa of 6.0 m. Electricity is £0.20 per kWh and motor efficiency 94% for both.
Shaft power in kW is flow in m³/h × head in m × specific gravity ÷ (366.6 × pump efficiency) [1]. Hydraulic power is 120 × 45 ÷ 366.6 = 14.73 kW for both.
| Item | Bid A | Bid B |
|---|---|---|
| Price | £16,800 | £13,900 |
| BEP flow | 130 m³/h | 96 m³/h |
| Duty as a share of BEP flow | 92%, inside the POR | 125%, outside the POR |
| Pump efficiency at duty | 77% | 71% |
| Shaft power at duty | 19.13 kW | 20.75 kW |
| Electrical input (÷ 0.94) | 20.35 kW | 22.07 kW |
| Energy cost per year | £32,560 | £35,310 |
| Highest power on offered curve | 21.60 kW at 165 m³/h | 23.07 kW at 145 m³/h |
| Motor offered | 30 kW | 22 kW |
| NPSHr at duty, and margin | 3.4 m, 2.6 m | 5.3 m, 0.7 m |
| Impeller offered, of maximum | 250 mm of 270 mm | 232 mm of 232 mm |
Bid B is £2,900 cheaper but draws 1.72 kW more: 1.72 × 8,000 = 13,760 kWh, about £2,750 a year. The price gap is recovered in just over a year, and over ten years, undiscounted, Bid A saves about £27,500 in energy, or about £24,600 after its higher price. Bid A's price is about 5% of its ten year energy bill of £325,600.
Bid B's curve ends at 145 m³/h, 35 m and 60% efficiency, taking 23.07 kW: about 5% more than its 22 kW motor. A lower system head than calculated could overload it. With Bid A's largest 270 mm impeller, the affinity laws suggest 21.60 × (270 ÷ 250)³ = 27.2 kW, still inside its motor, and roughly 17% more head. Bid B has no such headroom. At 125% of BEP it is outside even the widest POR, so ask the bidder to confirm the duty is inside its AOR. Its 0.7 m NPSH margin is thin outside the POR, as our NPSH guide explains; ask both bidders for NPSHr at the end of the curve, its largest flow [2].
Under grade 2B, either pump could pass 5% below its guarantee. If Bid A came in at 73.2% (77% × 0.95), it would lose more than half its energy advantage over Bid B's guaranteed 71%. If energy drives the award, ask for grade 1B or 1E at the duty point. A larger Bid B pump and motor would need a new quote.
Put the curve questions into the RFQ
Ask every bidder for the curve for the offered impeller and speed, with BEP flow, AOR, efficiency at duty, highest power, NPSHr and its basis, maximum impeller and test grade, in the same units. See our guide to technical bid evaluation.
AI Quotation Comparison puts supplier quotes side by side on commercial, technical, delivery, compliance and risk. AI extracts price, lead time, materials, certifications and scope for you to review, a rules based engine computes weighted scores, and quotes with mandatory gaps are flagged. The curve reading stays with your engineer, and the decision with the buyer. You can try it with up to three quotes without signing up.
Ready to compare pump bids on energy as well as price? Start a free 14 day ChemCapital trial, with no credit card needed.
Frequently asked questions
How do you read a pump curve?
Find your duty flow on the horizontal axis, go up to the head curve for the offered impeller, and read the efficiency, power and NPSHr at that same flow. Then check where that flow sits against the best efficiency point and what the highest power on the curve is.
What is the best efficiency point on a pump curve?
It is the flow at which the pump's efficiency peaks for that speed and impeller diameter, where vibration and noise are also low. The Hydraulic Institute's preferred operating region runs from as narrow as 90% to 110% up to 70% to 120% of BEP flow, depending on the pump.
Why should the motor cover the end of the pump curve?
On most low specific speed pumps power rises with flow, so if the system needs less head than calculated the pump runs further right and draws more power. A motor sized only for the duty point can then be overloaded.
What is the difference between a pump curve and a system curve?
The pump curve shows the head the pump delivers at each flow; the system curve shows the head the plant needs at each flow. The pump runs where the two cross, the operating point.
Continue reading
Informational only, not procurement or legal advice. Cited names, frameworks, and statistics belong to their respective owners.
Create and manage RFQs in minutes
ChemCapital handles the entire procurement cycle, from structured RFQs and supplier comparisons to formal purchase orders and delivery tracking.
Start for freeRelated articles
Where to Find Pharma and Chemical Plant Projects Before They Go to Tender: the 2027 Pipeline
Twenty pharma and chemical plant projects checked against owner or government announcements, the buying timeline on each, and where to watch for the next ones for free.
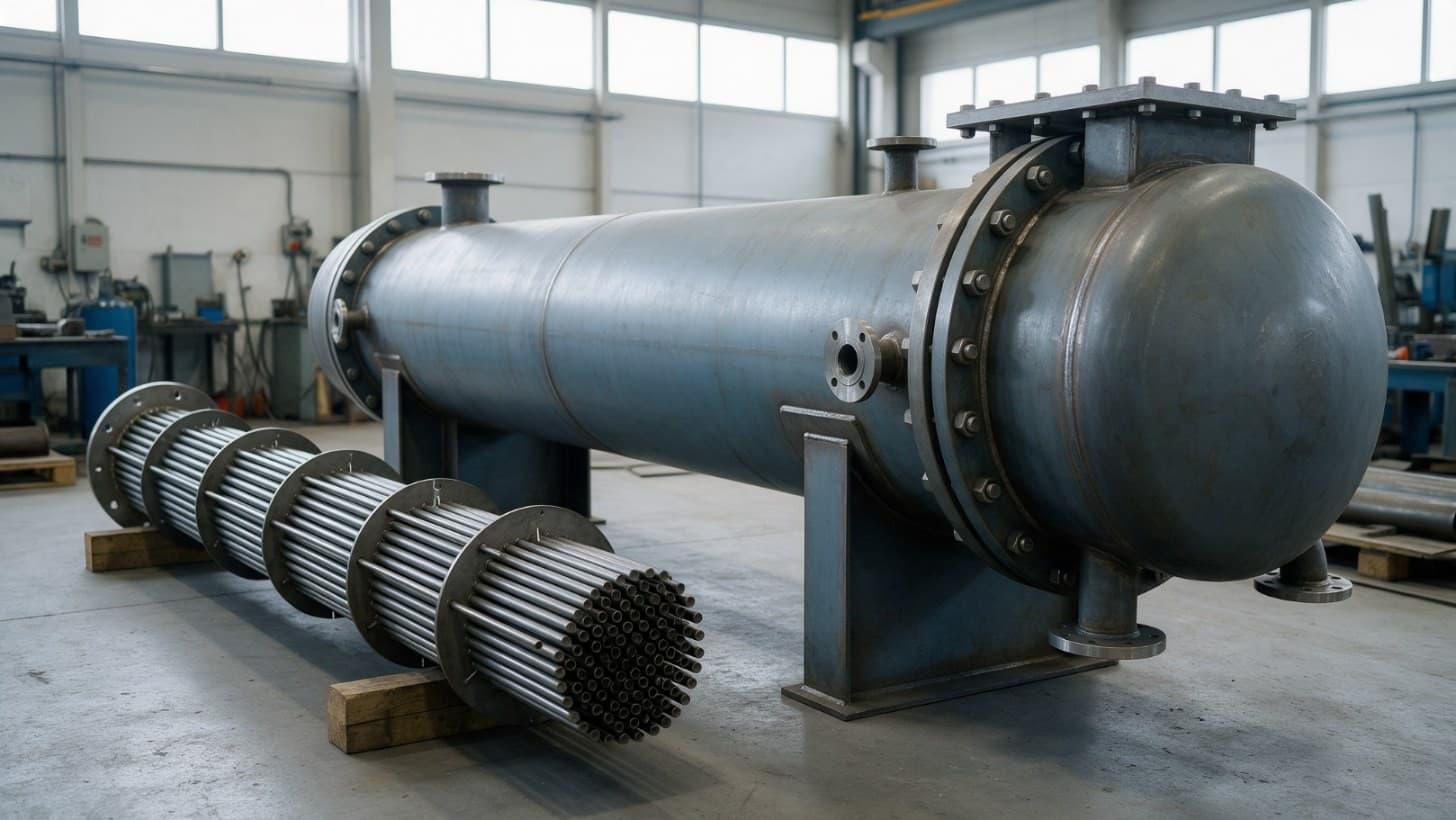
TEMA Heat Exchanger Types: How to Read AES, BEM and AEU
How to decode the three letter TEMA type, what AES, BEM, AEU and other common types mean for cleaning, expansion, leaks and cost, and how to compare bids that differ.
Safety Valve vs Relief Valve vs Bursting Disc: How to Choose
How safety valves, relief valves and bursting discs differ, when to fit a disc under a valve, the pressure terms that matter, GB duties and what to put in the RFQ.