
Life Cycle Cost: Comparing Equipment Quotes on Total Cost of Ownership
How to compare equipment quotes on life cycle cost instead of price: the cost elements, what to ask bidders for, discounting, and a worked pump example where the dearer quote wins.
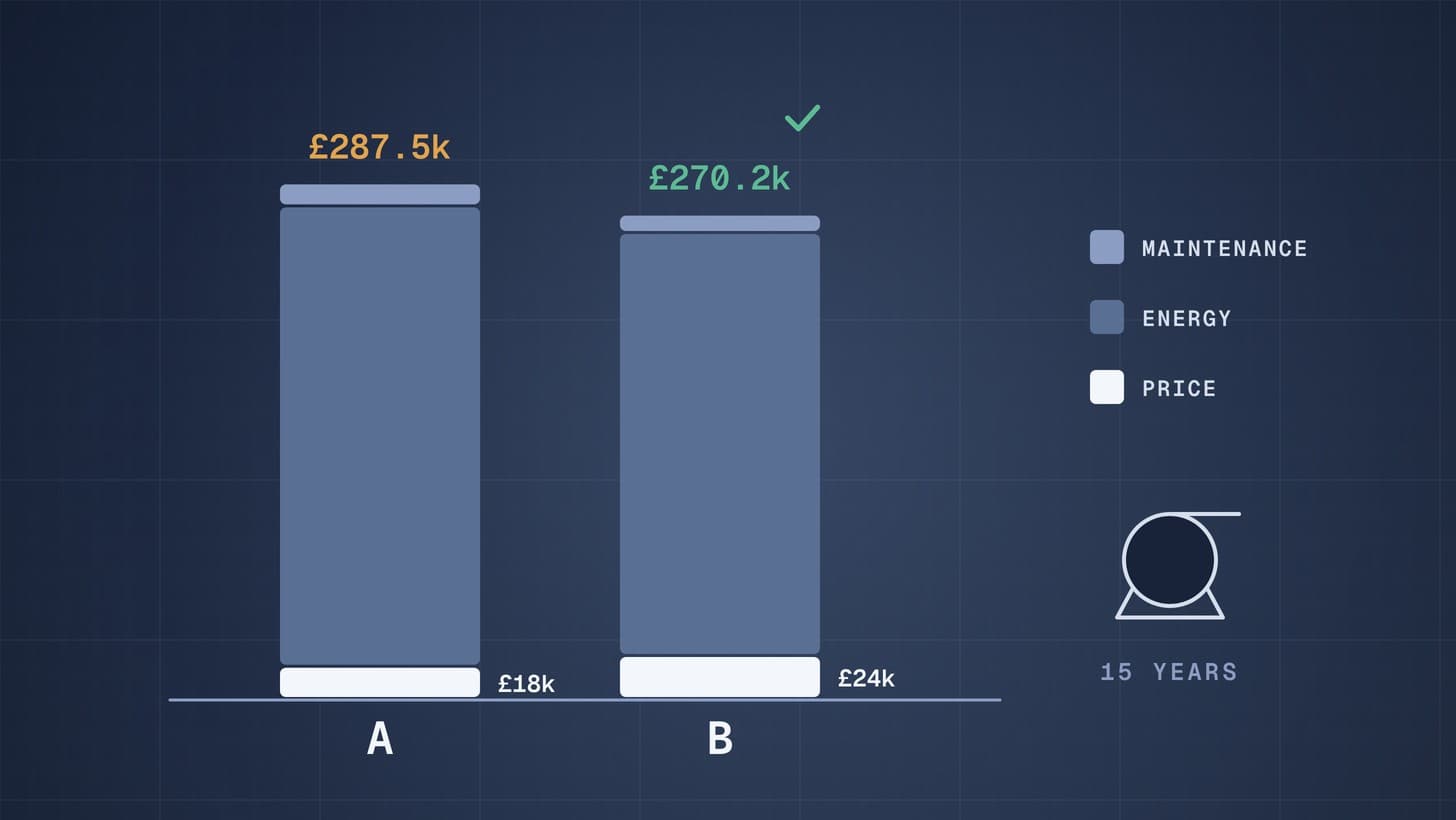
Life cycle cost is the total cost of owning a piece of equipment over its working life: the purchase price plus installation, energy, operation, maintenance, downtime, environmental costs and eventual disposal, usually brought back to a present value so that different quotes can be compared on one number. For equipment that runs for long hours, such as pumps, fans, compressors and agitators, running costs usually dwarf the price, so the cheapest quote is often the most expensive to own.
Comparing quotes on life cycle cost means asking every bidder for the data that drives those running costs, calculating them the same way for each bid, and putting the result into the commercial evaluation alongside the price.
Why this matters now
Energy has made the gap between price and cost of ownership hard to ignore. The UK government's quarterly energy prices release puts the average electricity price for manufacturers, excluding the Climate Change Levy, at a provisional 17.4 pence per kWh in the second quarter of 2026, and the average for all non domestic users including the levy at 24.51 pence per kWh, up 2.0% on a year earlier [1]. At 17.4 pence, a 20 kW electrical load running 8,000 hours a year costs about £27,800 a year to power.
The guidance has been updated too. The Hydraulic Institute and Europump published the second edition of their pump life cycle cost guide in 2021, expanding the treatment of net present value and internal rate of return [2]. For oil, gas and petrochemical facilities, ISO 15663:2021 sets out requirements and guidance for life cycle costing when choosing between options that differ in cost or economic value [3].
Create and manage RFQs in minutes
ChemCapital handles the entire procurement cycle, from structured RFQs and supplier comparisons to formal purchase orders and delivery tracking.
What goes into life cycle cost
The Hydraulic Institute, Europump and the US Department of Energy define life cycle cost for a pumping system as the sum of eight elements [4]:
| Element | What it covers | Where the number comes from |
|---|---|---|
| Initial cost | Equipment, piping and auxiliary services | The quotes |
| Installation and commissioning | Including training | Your estimate, or the bidder if they install |
| Energy | Driver, controls and auxiliaries | Bidder's power data, your operating hours and tariff |
| Operation | Labour for routine supervision | Your site |
| Maintenance and repair | Routine and expected repairs | Bidder's intervals and spares prices, your history |
| Downtime | Lost production when it fails | Your production value, bidder's reliability data |
| Environmental | For example contamination from leaks | Your site |
| Decommissioning and disposal | Including restoring the site | Your estimate |
The guide says lifetime energy or maintenance costs, or both, will dominate life cycle cost for most facilities, that the purchase price is a small part of it for pumps in heavy use, and that energy may dominate especially where pumps run more than 2,000 hours a year [4]. It also warns that unexpected downtime can rival energy and spare parts costs [4].
The Hydraulic Institute's own illustration for a typical medium sized industrial pumping system over a 15 to 20 year life puts the purchase price at about 10% of the total, energy at about 40%, maintenance at about 25%, and the remaining quarter in operation, installation, environmental costs and downtime [5]. For an electric motor alone, the picture is starker: a GAMBICA guide, citing European ecodesign study data for an 11 kW IE3 motor, gives energy as 96.7% of lifetime cost, purchase as 2.3% and maintenance as 1.0% [6].
What to ask bidders for
A life cycle comparison is only as fair as the data behind it. Ask every bidder for the same items, in the same units, in the RFQ:
- Guaranteed efficiency or power absorbed at your rated duty point, not at the best efficiency point of the pump. If the plant runs at several duties, ask for power at each.
- Motor efficiency class and efficiency at load.
- How the guarantee will be tested, for example a witnessed performance test to a stated standard and acceptance grade, and what happens if the test falls short.
- Recommended maintenance intervals and labour hours, such as seal replacement, bearing changes and inspections.
- Prices for the recommended spares, fixed for a stated period.
- Expected life of wear parts and any reliability data the bidder can stand behind.
- Auxiliary consumption, such as seal flush water, cooling water or nitrogen.
Our guide to reading a pump curve explains why the operating point matters: a pump chosen far from its best efficiency point wastes energy and wears faster, and the Hydraulic Institute advises keeping pumps near that point for the same reasons [5].
How to calculate it
Use one spreadsheet and one set of assumptions for every bid. The steps:
- Fix the operating profile: duty point or points, hours a year, and life (15 to 20 years is typical for medium industrial pumping systems [5]).
- Calculate energy per year for each bid: electrical input power times hours times tariff.
- Add maintenance and other running costs per year.
- Discount future costs to present value. The guide says it is practicable, and possibly essential, to calculate a present or discounted value, using present energy prices, the expected rise in energy prices, the discount rate, the interest rate and the expected life [4]. Use your company's own discount rate, which finance will usually provide.
- Add the one off costs: price, installation, and decommissioning at the end of life.
- Test the sensitivity. Rerun with fewer hours, a lower tariff and a higher discount rate. If the ranking does not change, the decision is robust.
Practical example
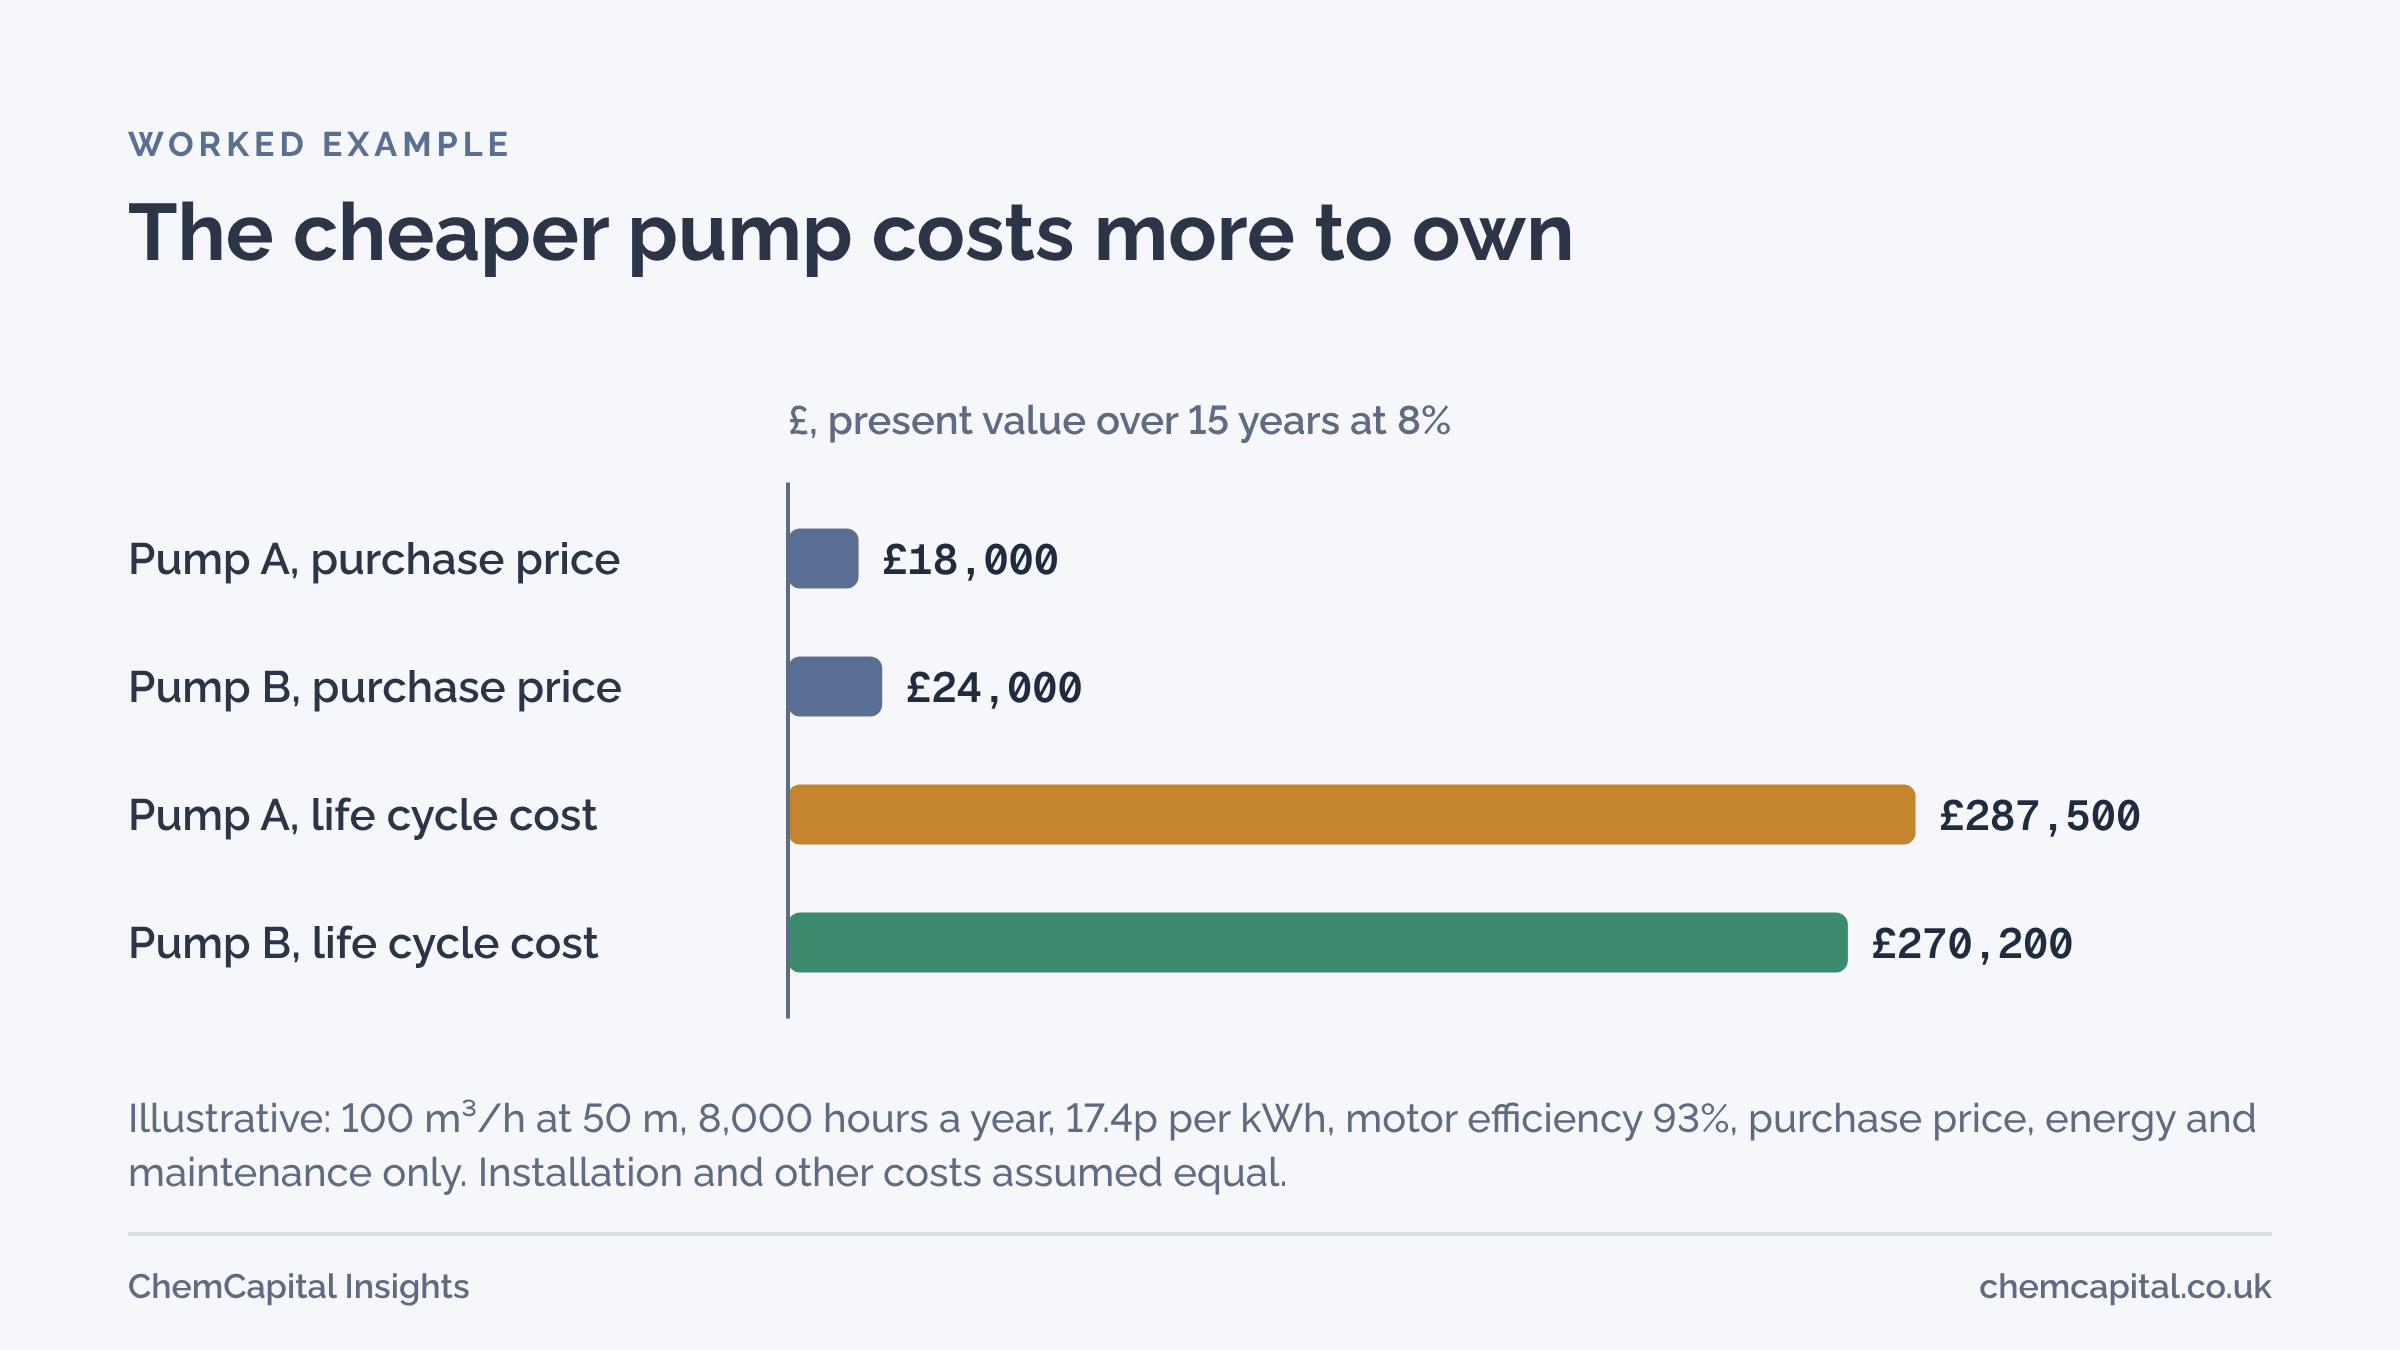
In this illustrative example, two bidders quote a centrifugal pump for 100 m³/h at 50 m head of water, running 8,000 hours a year for 15 years. Both offer a motor of 93% efficiency. Electricity is taken at 17.4 pence per kWh, the provisional manufacturing average for the second quarter of 2026 [1], held flat. The company discount rate is 8%. Installation, operation and disposal are assumed equal, so they cancel out.
The hydraulic power is about 13.6 kW.
| Pump A | Pump B | |
|---|---|---|
| Price | £18,000 | £24,000 |
| Guaranteed pump efficiency at duty | 68% | 74% |
| Shaft power | 20.0 kW | 18.4 kW |
| Electrical input | 21.55 kW | 19.80 kW |
| Energy per year | £29,991 | £27,559 |
| Maintenance per year (bidder's data) | £1,500 | £1,200 |
| Present value of 15 years of energy | £256,703 | £235,889 |
| Present value of maintenance | £12,839 | £10,271 |
| Life cycle cost (present value) | £287,542 | £270,161 |
Pump B costs £6,000 more to buy but about £2,432 a year less to power and £300 a year less to maintain. Its simple payback is about 2.2 years, and over 15 years its life cycle cost is about £17,400 lower in present value terms.
The sensitivity check matters. At 4,000 hours a year, pump B's advantage after paying its £6,000 premium falls to about £7,000 in present value; at 2,000 hours, to under £1,800, which is close enough that a difference in spares prices or lead time could reverse the decision. This is the point the Hydraulic Institute makes about run time: the longer the hours, the more the energy line decides the answer [4].
Two practical safeguards follow. Write the guaranteed efficiency into the order, with a test to prove it and a remedy if it falls short; otherwise a bidder can win on a number it never has to meet. And keep the evaluation transparent: show bidders, in the RFQ, that energy will be evaluated at a stated tariff and hours, so they can offer their most efficient option.
Putting life cycle cost into the evaluation
There are two common ways to use the result. The simpler is an evaluated price: price plus the present value of energy and maintenance, used in place of price in the commercial score. The other is to keep price and life cycle cost as separate criteria with their own weights. Either way, decide and publish the method before bids arrive. BCG's study of capital procurement describes a mining company that standardised the total cost of ownership models used by all its sites, so every site compared equipment the same way [7]; consistency matters more than precision. Our guide to commercial bid evaluation shows where an evaluated price sits among the other commercial criteria, and the quotation comparison sheet gives a layout you can extend with an energy line.
Where ChemCapital fits
ChemCapital sends one structured RFQ to several suppliers, so every bidder is asked for the same efficiency, power and spares data, and quotes come back in a consistent format. The AI quotation comparison extracts price, lead time, materials, certifications and scope from each quote, keeps the source text beside every extracted field, checks for missing fields and unit mismatches, and scores bids with adjustable weights across commercial, technical, delivery, compliance and risk. Mandatory failures are flagged and left out of the ranking, and people make the final call. You can try the free version with up to three quotes and no account.
Ready to compare equipment bids on what they will really cost you? Start a free 14 day ChemCapital trial, with no credit card needed.
Frequently asked questions
What is life cycle cost in procurement?
It is the total cost of owning a piece of equipment over its life: purchase, installation, energy, operation, maintenance, downtime, environmental costs and disposal. Future costs are usually discounted to a present value so that quotes can be compared on one number.
Is total cost of ownership the same as life cycle cost?
In equipment buying the two terms are used almost interchangeably. Life cycle cost is the term used in the Hydraulic Institute and Europump guide and in ISO 15663, while total cost of ownership is more common in procurement teams.
When is life cycle cost worth calculating?
Whenever running costs are large compared with the price, such as pumps, compressors, fans and agitators that run for long hours. The Hydraulic Institute notes energy can dominate for pumps running more than 2,000 hours a year.
Informational only, not procurement or legal advice. Cited names, frameworks, and statistics belong to their respective owners.
Create and manage RFQs in minutes
ChemCapital handles the entire procurement cycle, from structured RFQs and supplier comparisons to formal purchase orders and delivery tracking.
Start for freeRelated articles
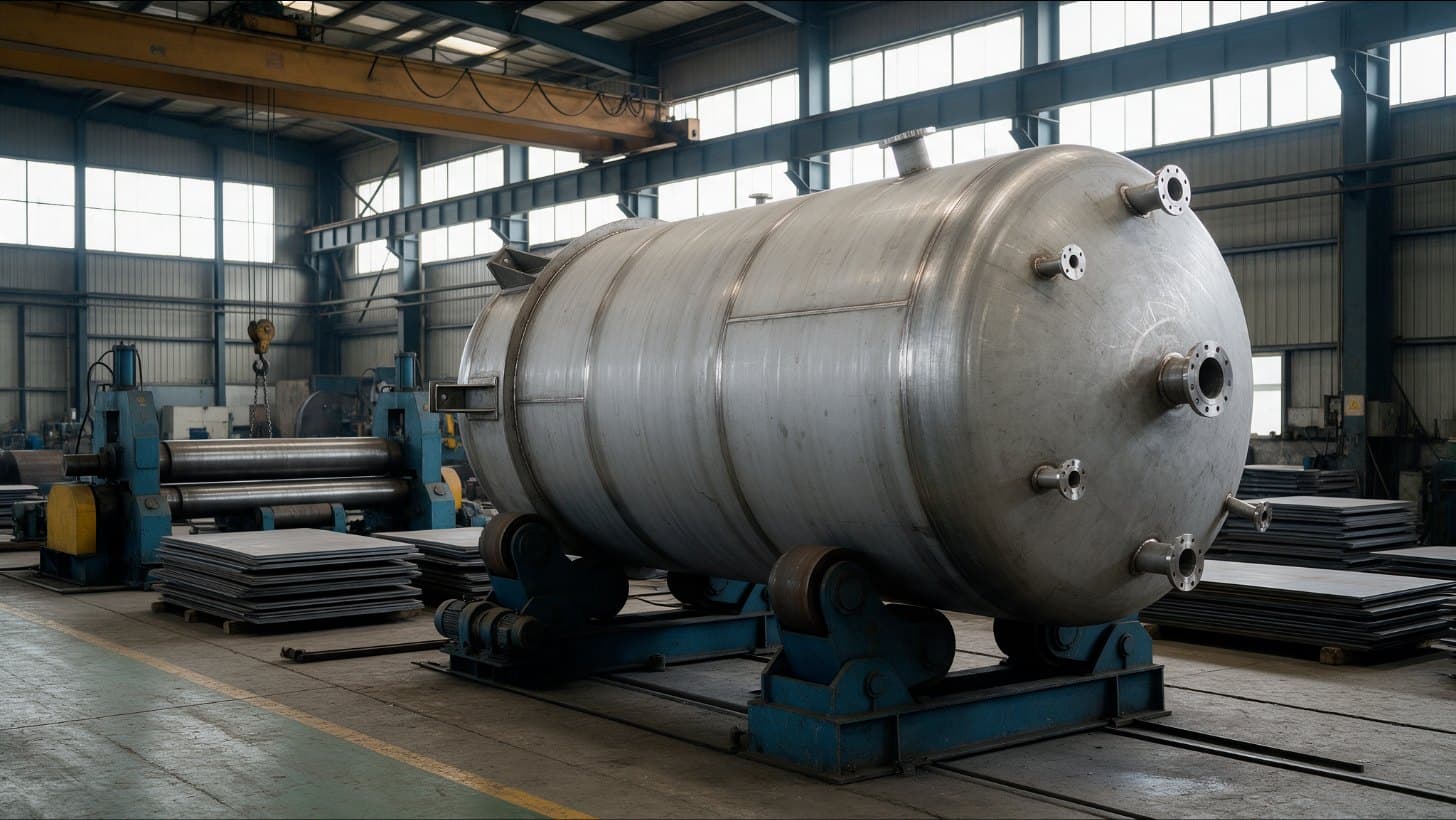
Should Cost Analysis for Fabricated Equipment: Vessels and Skids
How to build a should cost model for a pressure vessel or process skid from materials, welding hours, testing, overheads and margin, with a worked stainless vessel example and how to use it.
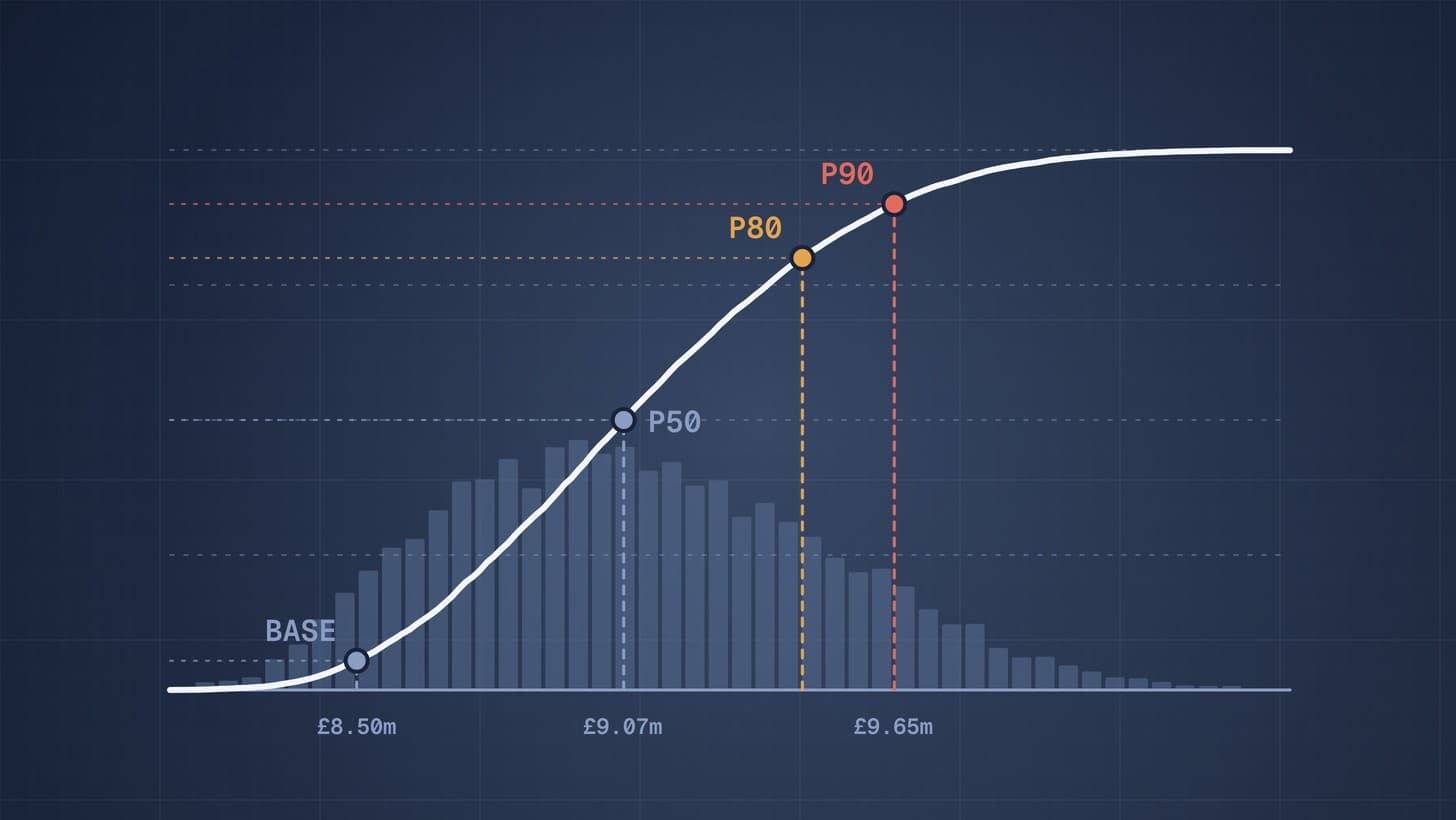
Cost Risk Analysis: P50, P80 and P90 Estimates with a Worked Example
What P50, P80 and P90 mean, how range estimating and Monte Carlo simulation produce them, a worked three item example, and how owners choose a funding level.
Price Adjustment, Escalation and Currency Clauses in Equipment Quotes
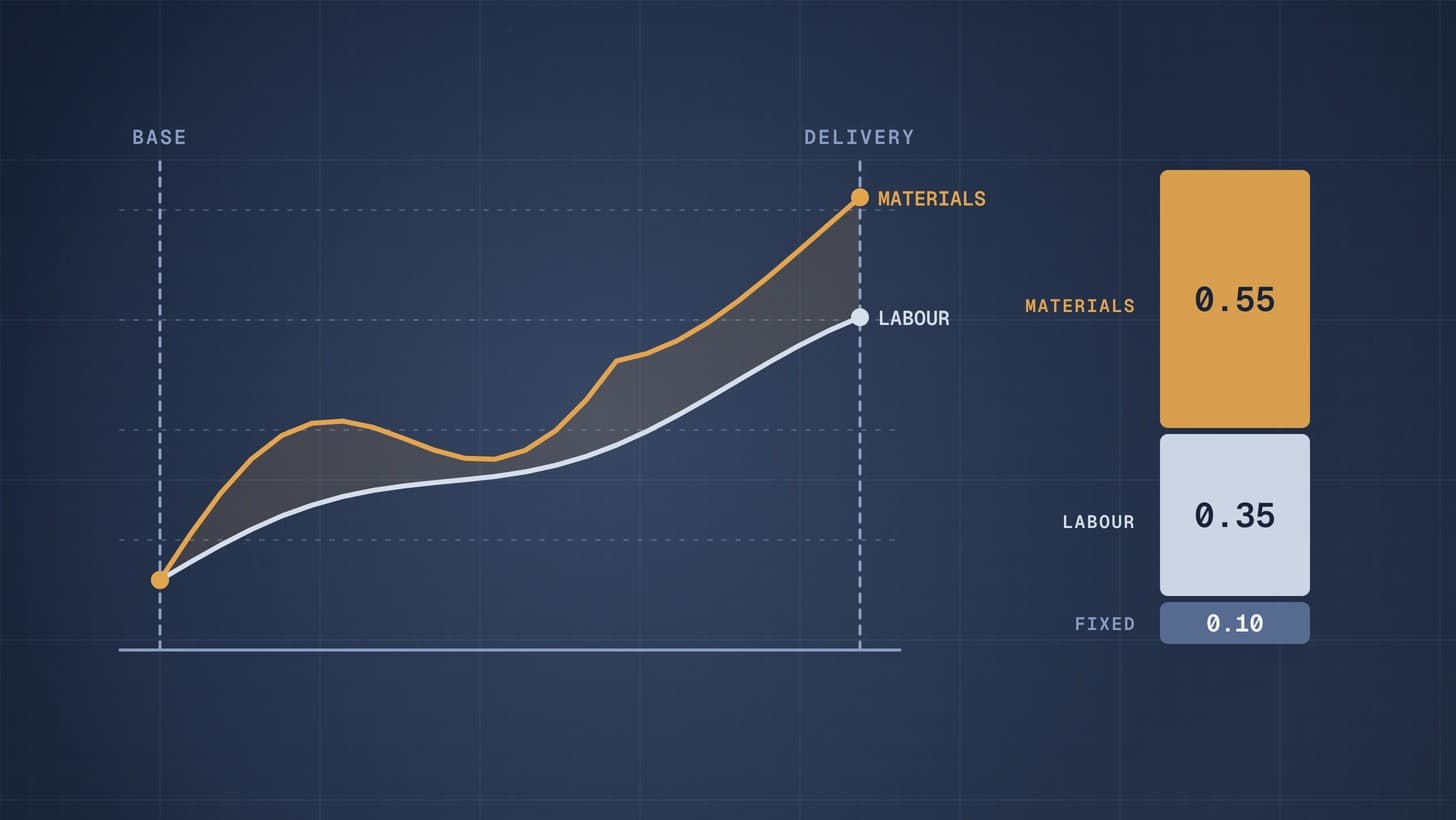
Why long lead equipment quotes carry escalation and alloy surcharge clauses, how the standard index formula works, what to agree, and how to compare a fixed and an adjustable bid.