
Pump Total Cost of Ownership: Worked Example
How to calculate a pump's total cost of ownership with the Hydraulic Institute and Europump life cycle cost method, comparing two bids over 15 years in present value.
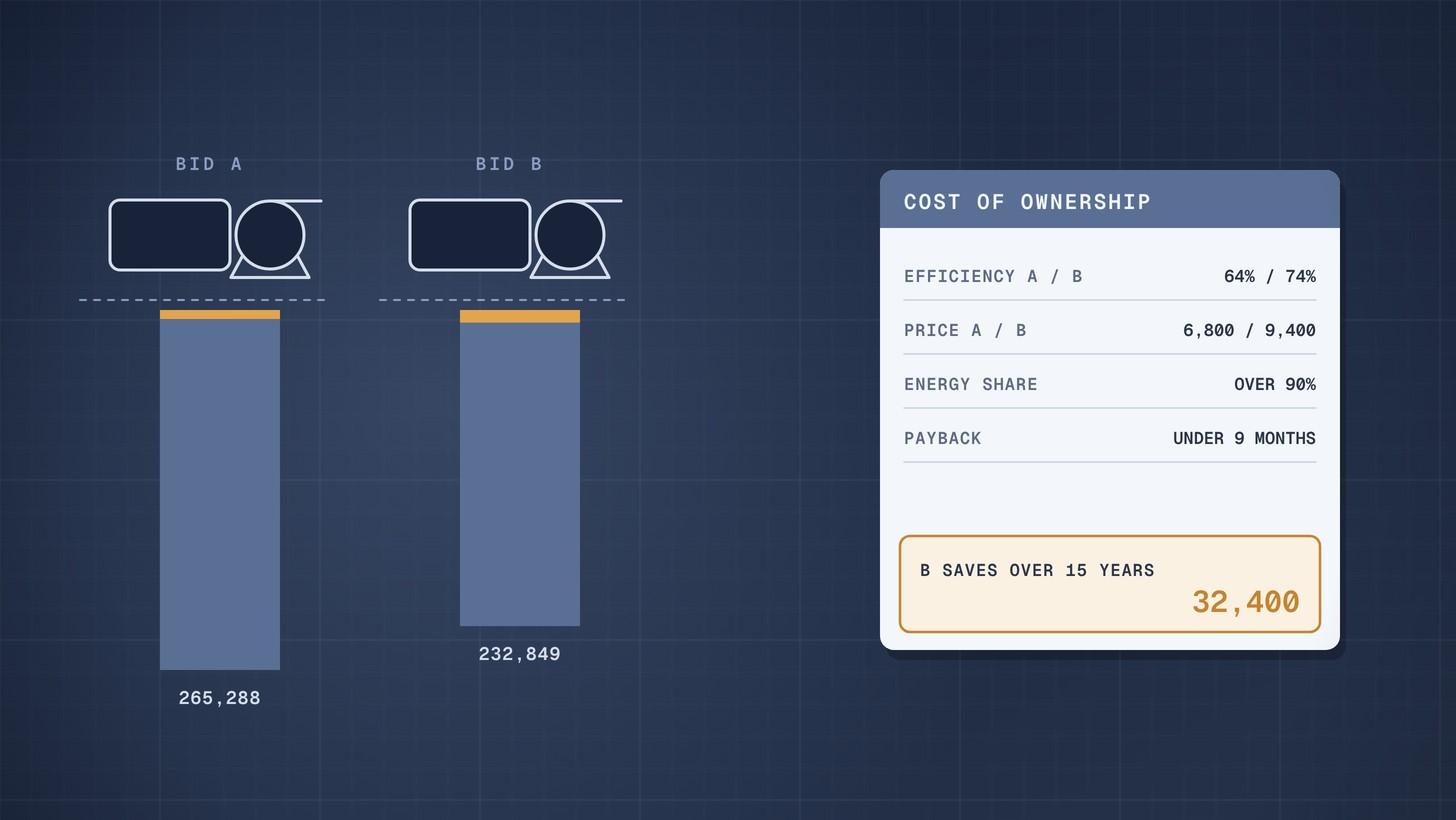
A pump's total cost of ownership is everything it costs over its life: purchase, installation, energy, operation, maintenance, downtime, environmental costs and disposal, with future costs brought back to today's money. In the worked example below, the dearer of two pump bids costs £2,600 more to buy but about £32,400 less to own over 15 years, because energy is over 90% of the total.
The Hydraulic Institute and Europump set out the method in their guide to pump life cycle costs. The steps below follow it, with numbers you can check.
Why this matters now
Pump purchases are still often awarded on price. Yet the joint guide from the Hydraulic Institute, Europump and the US Department of Energy says that for most facilities, lifetime energy and maintenance costs dominate, and that energy may dominate for pumps running more than 2,000 hours a year [1]. A Lawrence Berkeley National Laboratory paper adds that the purchase price is a small part of the total cost of running a system over its life [2].
In its case study, a conventional pumping system's 15 year costs were $771,500, of which energy was $636,900 and the pump itself $20,600 [2]. A few points of efficiency are worth far more than a discount on the price.
Create and manage RFQs in minutes
ChemCapital handles the entire procurement cycle, from structured RFQs and supplier comparisons to formal purchase orders and delivery tracking.
The life cycle cost equation
The guide defines life cycle cost as the sum of eight elements [1]:
| Element | What it covers |
|---|---|
| Initial cost | Pump, system, pipework and auxiliary services |
| Installation and commissioning | Including training |
| Energy | Driver, controls and auxiliaries |
| Operation | Labour for normal supervision |
| Maintenance and repair | Routine and predicted |
| Downtime | Lost production |
| Environmental | Contamination from the liquid or auxiliaries |
| Decommissioning and disposal | Including restoring the site |
Because these costs fall in different years, the guide says it is practical, and possibly essential, to calculate a present value. It lists the inputs: today's energy price, the expected yearly rise, the discount rate, the interest rate and the expected life [1].
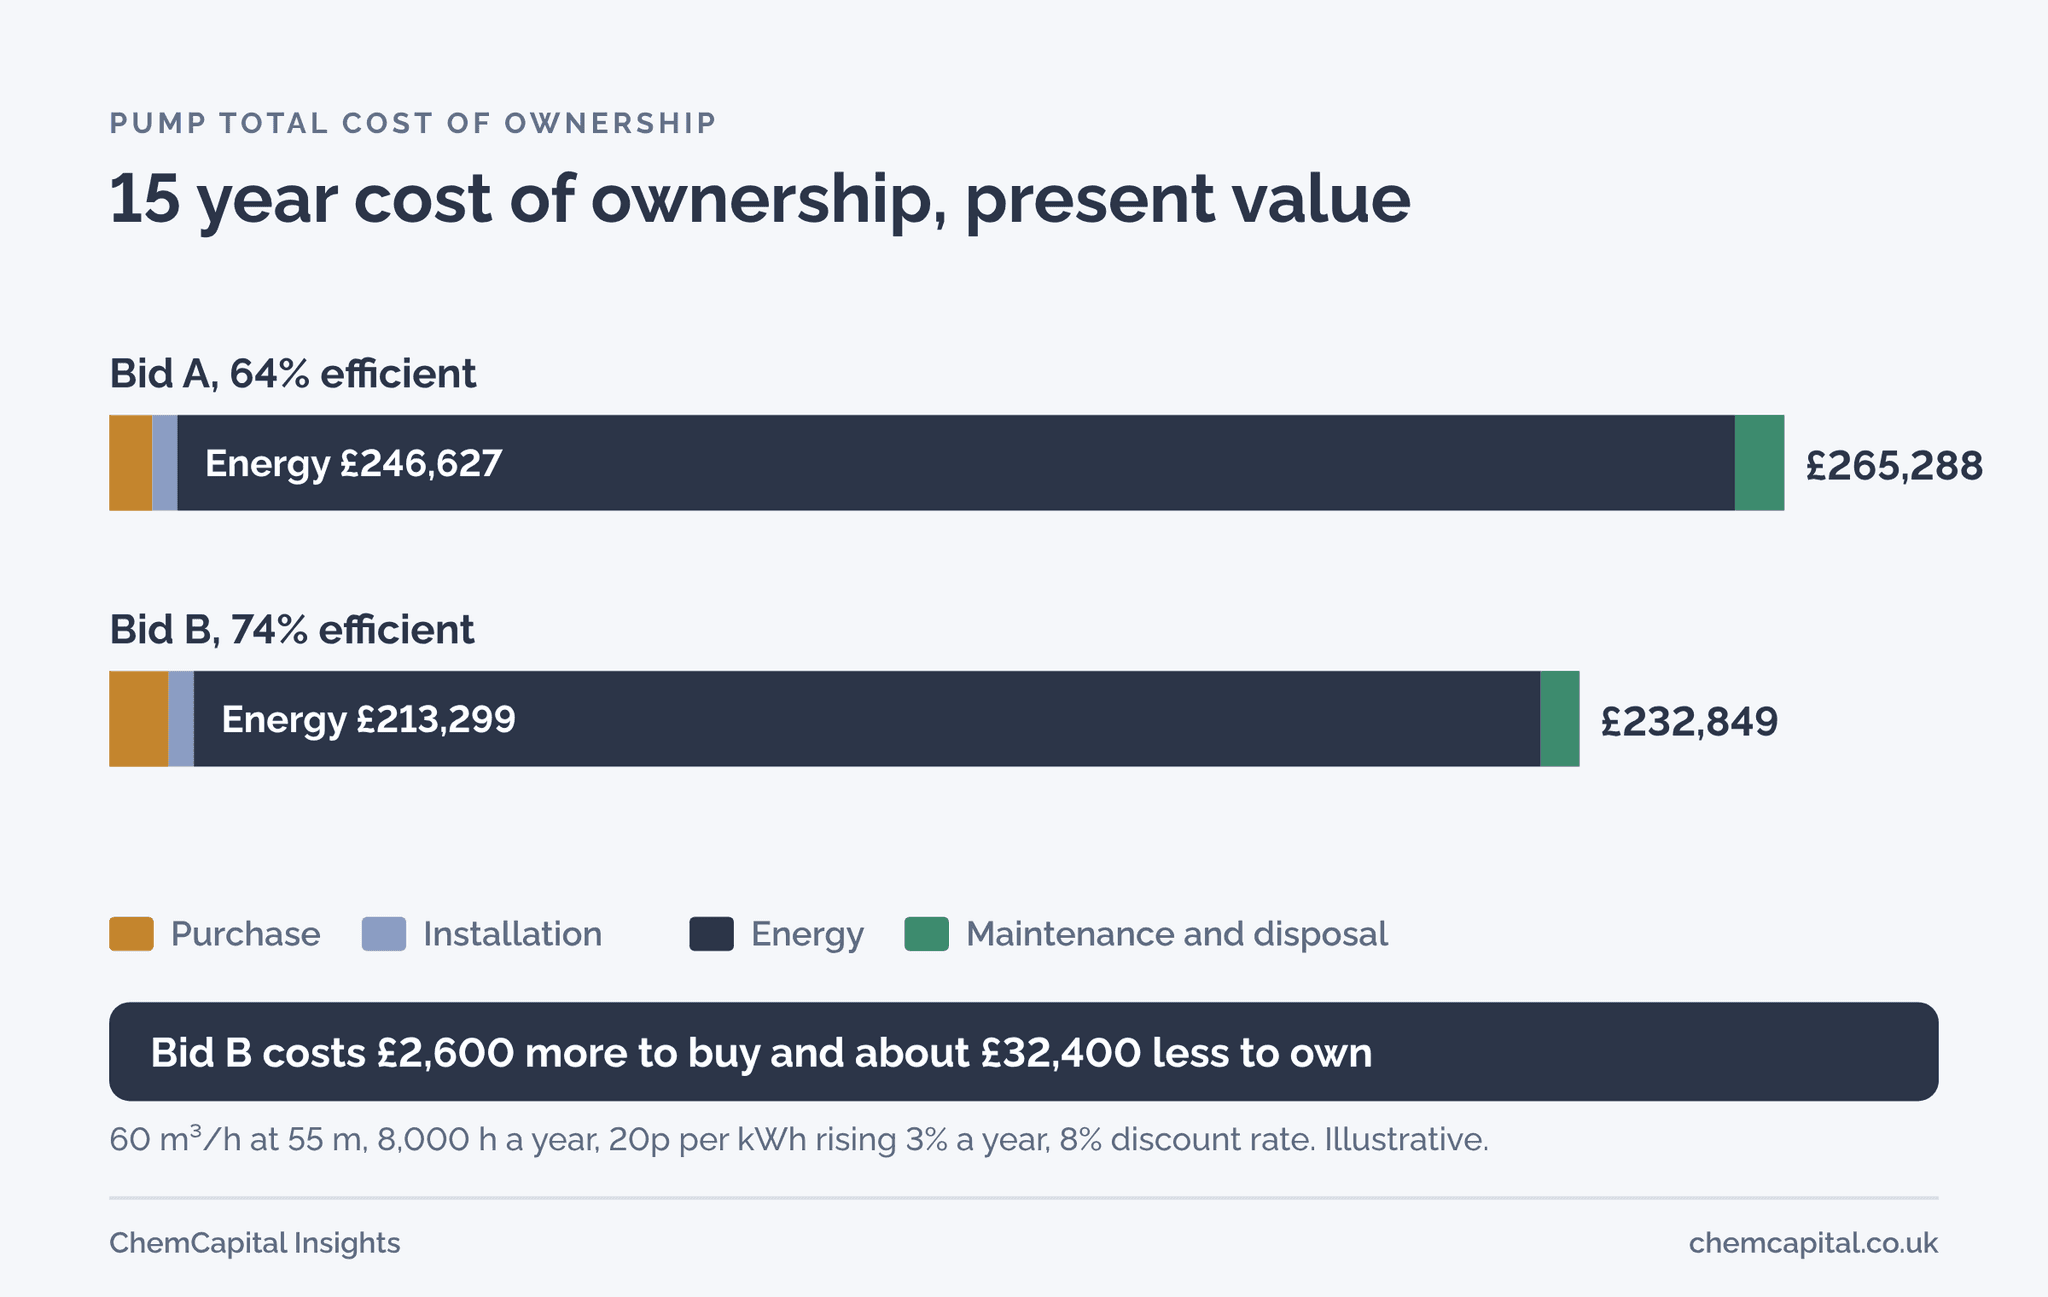
Worked example: two bids for the same duty
A site needs a pump for 60 m³/h of water at 55 m head, running 8,000 hours a year. Two suppliers quote. Prices, efficiencies, maintenance, tariff, discount rate and energy escalation are illustrative.
| Bid A | Bid B | |
|---|---|---|
| Pump set price | £6,800 | £9,400 |
| Pump efficiency at duty | 64% | 74% |
| Installation and commissioning | £4,000 | £4,000 |
| Yearly maintenance | £900 | £700 |
| Disposal at year 15 | £500 | £500 |
Step 1: energy per year. Hydraulic power is ρ × g × Q × H ÷ 3,600 with Q in m³/h [3]: 998 × 9.81 × 60 × 55 ÷ 3,600 = 8.98 kW. Shaft power is that divided by pump efficiency [3], and electrical power divides again by motor efficiency, here 92.6%, the IE3 minimum for an 18.5 kW four pole motor [4].
- Bid A: 8.98 ÷ 0.64 ÷ 0.926 = 15.15 kW, or £24,233 a year at 20p per kWh
- Bid B: 8.98 ÷ 0.74 ÷ 0.926 = 13.10 kW, or £20,958 a year
Step 2: present value over 15 years. Discount at 8% and let energy prices rise 3% a year.
| Present value, 15 years | Bid A | Bid B |
|---|---|---|
| Purchase | £6,800 | £9,400 |
| Installation | £4,000 | £4,000 |
| Energy | £246,627 | £213,299 |
| Maintenance | £7,704 | £5,992 |
| Disposal | £158 | £158 |
| Life cycle cost | £265,288 | £232,849 |
| Energy share | 93% | 92% |
Bid B costs £2,600 more to buy and saves about £3,475 a year in energy and maintenance, so it pays back the difference in under nine months. Over the life of the pump it is worth about £32,400 in today's money. Even without discounting, the 15 year totals are about £388,000 and £339,000.
How running hours change the answer
The energy term scales with running hours, so the case for the efficient pump weakens on a pump that runs little. Repeat the calculation for Bid A and Bid B at other hours, with everything else unchanged:
| Running hours a year | Bid A life cycle cost | Bid B life cycle cost | Bid B saves |
|---|---|---|---|
| 8,000 | £265,288 | £232,849 | £32,440 |
| 4,000 | £141,975 | £126,199 | £15,776 |
| 2,000 | £80,318 | £72,874 | £7,444 |
| 1,000 | £49,490 | £46,212 | £3,278 |
| 500 | £34,075 | £32,880 | £1,195 |
Bid B stays ahead even at 500 hours, partly because its maintenance is £200 a year lower; on these figures the two only break even at around 210 hours a year. For a standby pump that hardly runs, though, the price and the spares matter far more than efficiency. The guide's threshold of about 2,000 hours a year, above which energy may dominate [1], is a useful rule for deciding how much effort to put into the comparison.
Putting a price on downtime
Downtime is the element most often left out, and the guide warns it can rival energy and spares [1]. Suppose Bid A's simpler seal arrangement is expected to cause one extra eight hour stop every three years, and a stop costs £1,500 an hour in lost margin (both illustrative). Discounted at 8%, five such stops over 15 years are worth about £31,600 today, almost doubling the gap between the bids.
Put your own downtime cost per hour into the RFQ evaluation. If a pump trip stops a whole line, it can outweigh every other number in the table, and it is the strongest argument for an installed spare or a better sealing system.
What else to put in the comparison
- Duty point. Efficiency must be read at your duty, not at the pump's best efficiency point. A bid that looks efficient at its best point may be poor at yours. Our guide on how to read a pump curve shows where to look.
- Downtime. The guide notes downtime can rival energy and spares in its impact [1]. If a pump stop halts production, a sparing arrangement or better seal can outweigh everything else.
- Control method. In the guide's own example, trimming an impeller had a lower life cycle cost than changing or repairing a control valve, or fitting a variable speed drive [1]. Which option wins depends on the system. Our VFD energy savings calculation shows how to test a drive.
- Oversizing. The Department of Energy's pumping sourcebook warns that oversizing adds energy and maintenance costs [5]. A pump selected far to the left of its best point wastes energy every hour it runs.
Turning it into a bid evaluation
Ask every bidder for efficiency and power at your duty, motor efficiency class, recommended spares and their prices, the service interval and the expected seal life. With those, the calculation above takes minutes per bid. Our broader guide to life cycle cost in equipment quotes shows how to weight it against price and delivery.
ChemCapital's AI quotation comparison extracts each pump bid's price, efficiency, power and spares into one table, so the bid with the lowest cost of ownership is easy to see.
Ready to award pump orders on cost of ownership, not just price? Start a free 14 day ChemCapital trial, with no credit card needed.
Frequently asked questions
How do you calculate pump total cost of ownership?
Add the initial cost, installation, energy, operation, maintenance, downtime, environmental and disposal costs over the pump's life, using present values for future years. Energy is usually the largest item, so calculate it from the power at your duty point, the running hours and your electricity price.
What share of a pump's life cycle cost is energy?
Usually most of it for pumps that run many hours. In the worked example energy is over 90% of the 15 year cost, and in one published case study it was about 83%. The purchase price is typically a few per cent.
Is a more efficient pump worth a higher price?
Often, for pumps running more than about 2,000 hours a year. In the example, a pump 10 points more efficient costs £2,600 more but saves about £3,475 a year, paying back in under nine months.
What is the life cycle cost equation for pumps?
The Hydraulic Institute and Europump define it as LCC = initial cost + installation and commissioning + energy + operation + maintenance and repair + downtime + environmental cost + decommissioning and disposal, with future costs discounted to present value.
Continue reading
Informational only, not procurement or legal advice. Cited names, frameworks, and statistics belong to their respective owners.
Create and manage RFQs in minutes
ChemCapital handles the entire procurement cycle, from structured RFQs and supplier comparisons to formal purchase orders and delivery tracking.
Start for freeRelated articles
Full Expensing for Plant and Machinery: Worked Example (UK)
How full expensing, the annual investment allowance, first year allowances and writing down allowances apply to a £500,000 process skid, with the November 2026 rates.
Spare Parts Carrying Cost: Worked Example
How to calculate the yearly carrying cost of spare parts, build your own carrying rate and decide which items on a recommended spares list are worth stocking.
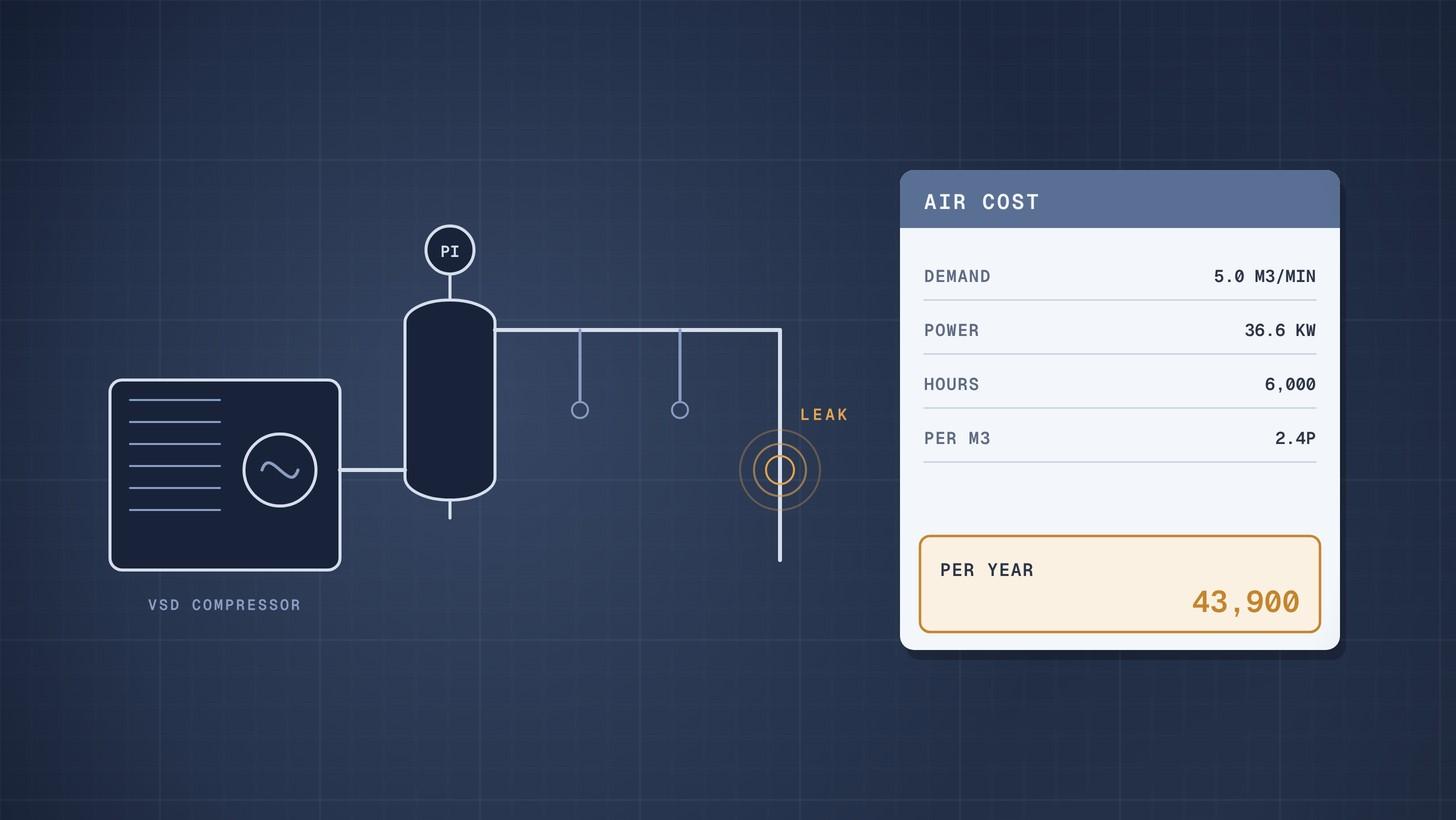
Compressed Air Cost per Year: Worked Example
How to calculate the yearly running cost and cost per cubic metre of compressed air from a compressor data sheet, compare fixed and variable speed, and price leaks and pressure.