
VFD Energy Savings for Pumps: Worked Example
How to calculate the energy a variable speed drive saves on a pump using the system curve and a duty profile, why the affinity laws overstate it, and when a drive does not pay.
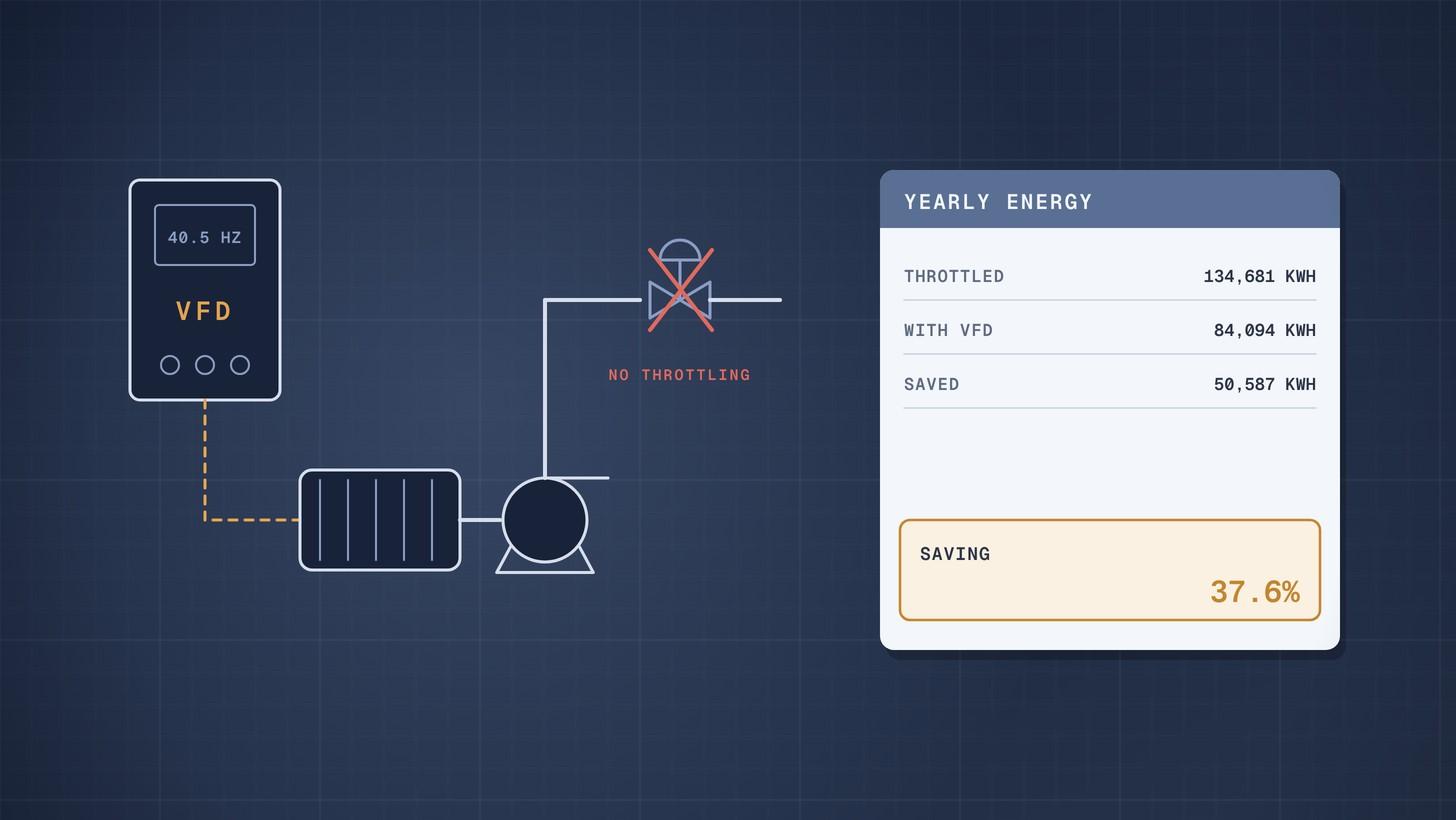
To calculate the energy a variable speed drive (VFD) saves on a pump, work out the electrical power at each operating flow twice, once with a throttling valve and once at reduced speed, multiply each by the hours spent there, and take the difference. In the worked example below, a pump that spends most of its time below full flow uses 37.6% less electricity with a VFD, about £10,100 a year. The same pump on a system with high static head saves only 14.3%.
The affinity laws give a quick upper bound, but on most real process systems they overstate the saving. The method below uses the system curve, which is what decides the answer.
Why this matters now
Many pumps in process plants run against a part closed control valve for most of their lives. The valve burns off head the pump has just produced, and the motor pays for it. A drive slows the pump instead, so it only makes the head the system needs.
Variable Speed Pumping, a guide from the Hydraulic Institute, Europump and the US Department of Energy, states that flow control by speed is always more efficient than by a control valve, and reports many installations saving 30% to 50% [1]. The same guide warns that systems with high static head save less, and that using the affinity laws alone there can lead to major errors [1]. That is why a proper calculation matters before you buy the drive, or before you accept a supplier's savings claim.
Create and manage RFQs in minutes
ChemCapital handles the entire procurement cycle, from structured RFQs and supplier comparisons to formal purchase orders and delivery tracking.
Why the affinity laws overstate savings
With no static head, flow is proportional to speed and power to the cube of speed. The Department of Energy notes that a 20% cut in speed can then reduce input power by about 50% [2]. Danfoss makes the same point, and adds that real savings differ because of the system [3].
Most process systems do have static head: a level difference or a pressure in the receiving vessel. The Hydraulic Institute describes static head as the part of the system curve that does not change with flow [4]. A pump slowed down must still make at least that head, so speed cannot fall as far as the cube law suggests, and the pump moves away from its best efficiency point. Our guide to the pump affinity laws covers the laws themselves.
The calculation in five steps
- Duty profile. How many hours a year at each flow. This is the input that most often decides whether a drive pays.
- System curve. Static head plus friction head, which rises with the square of flow [4].
- Throttled case. At each flow, read the pump's head and efficiency at full speed. Shaft power is ρgQH ÷ η with H the full speed head.
- Variable speed case. At each flow, find the speed at which the pump curve meets the system curve, and the pump efficiency there. Shaft power uses the system head, not the full speed head.
- Electrical power and energy. Divide by motor efficiency, and in the drive case by drive efficiency too, then multiply by hours. The Department of Energy lists typical efficiencies for a 20 horsepower drive of 97% at full load and 96% at 50% to 75% load [2], and notes that system efficiency is drive × motor × pump efficiency [2].
Worked example: a transfer pump with a varying duty
A pump delivers up to 100 m³/h of water. The system has 20 m of static head and 30 m of friction head at 100 m³/h. The pump curve, efficiency curve, duty profile, drive price and electricity tariff are illustrative; the drive efficiencies follow the Department of Energy table.
- Pump: 50 m at 100 m³/h, best efficiency 78% at 100 m³/h
- Motor efficiency: 93%
- Running hours: 8,000 a year, of which 20% at 100 m³/h, 50% at 70 m³/h and 30% at 50 m³/h
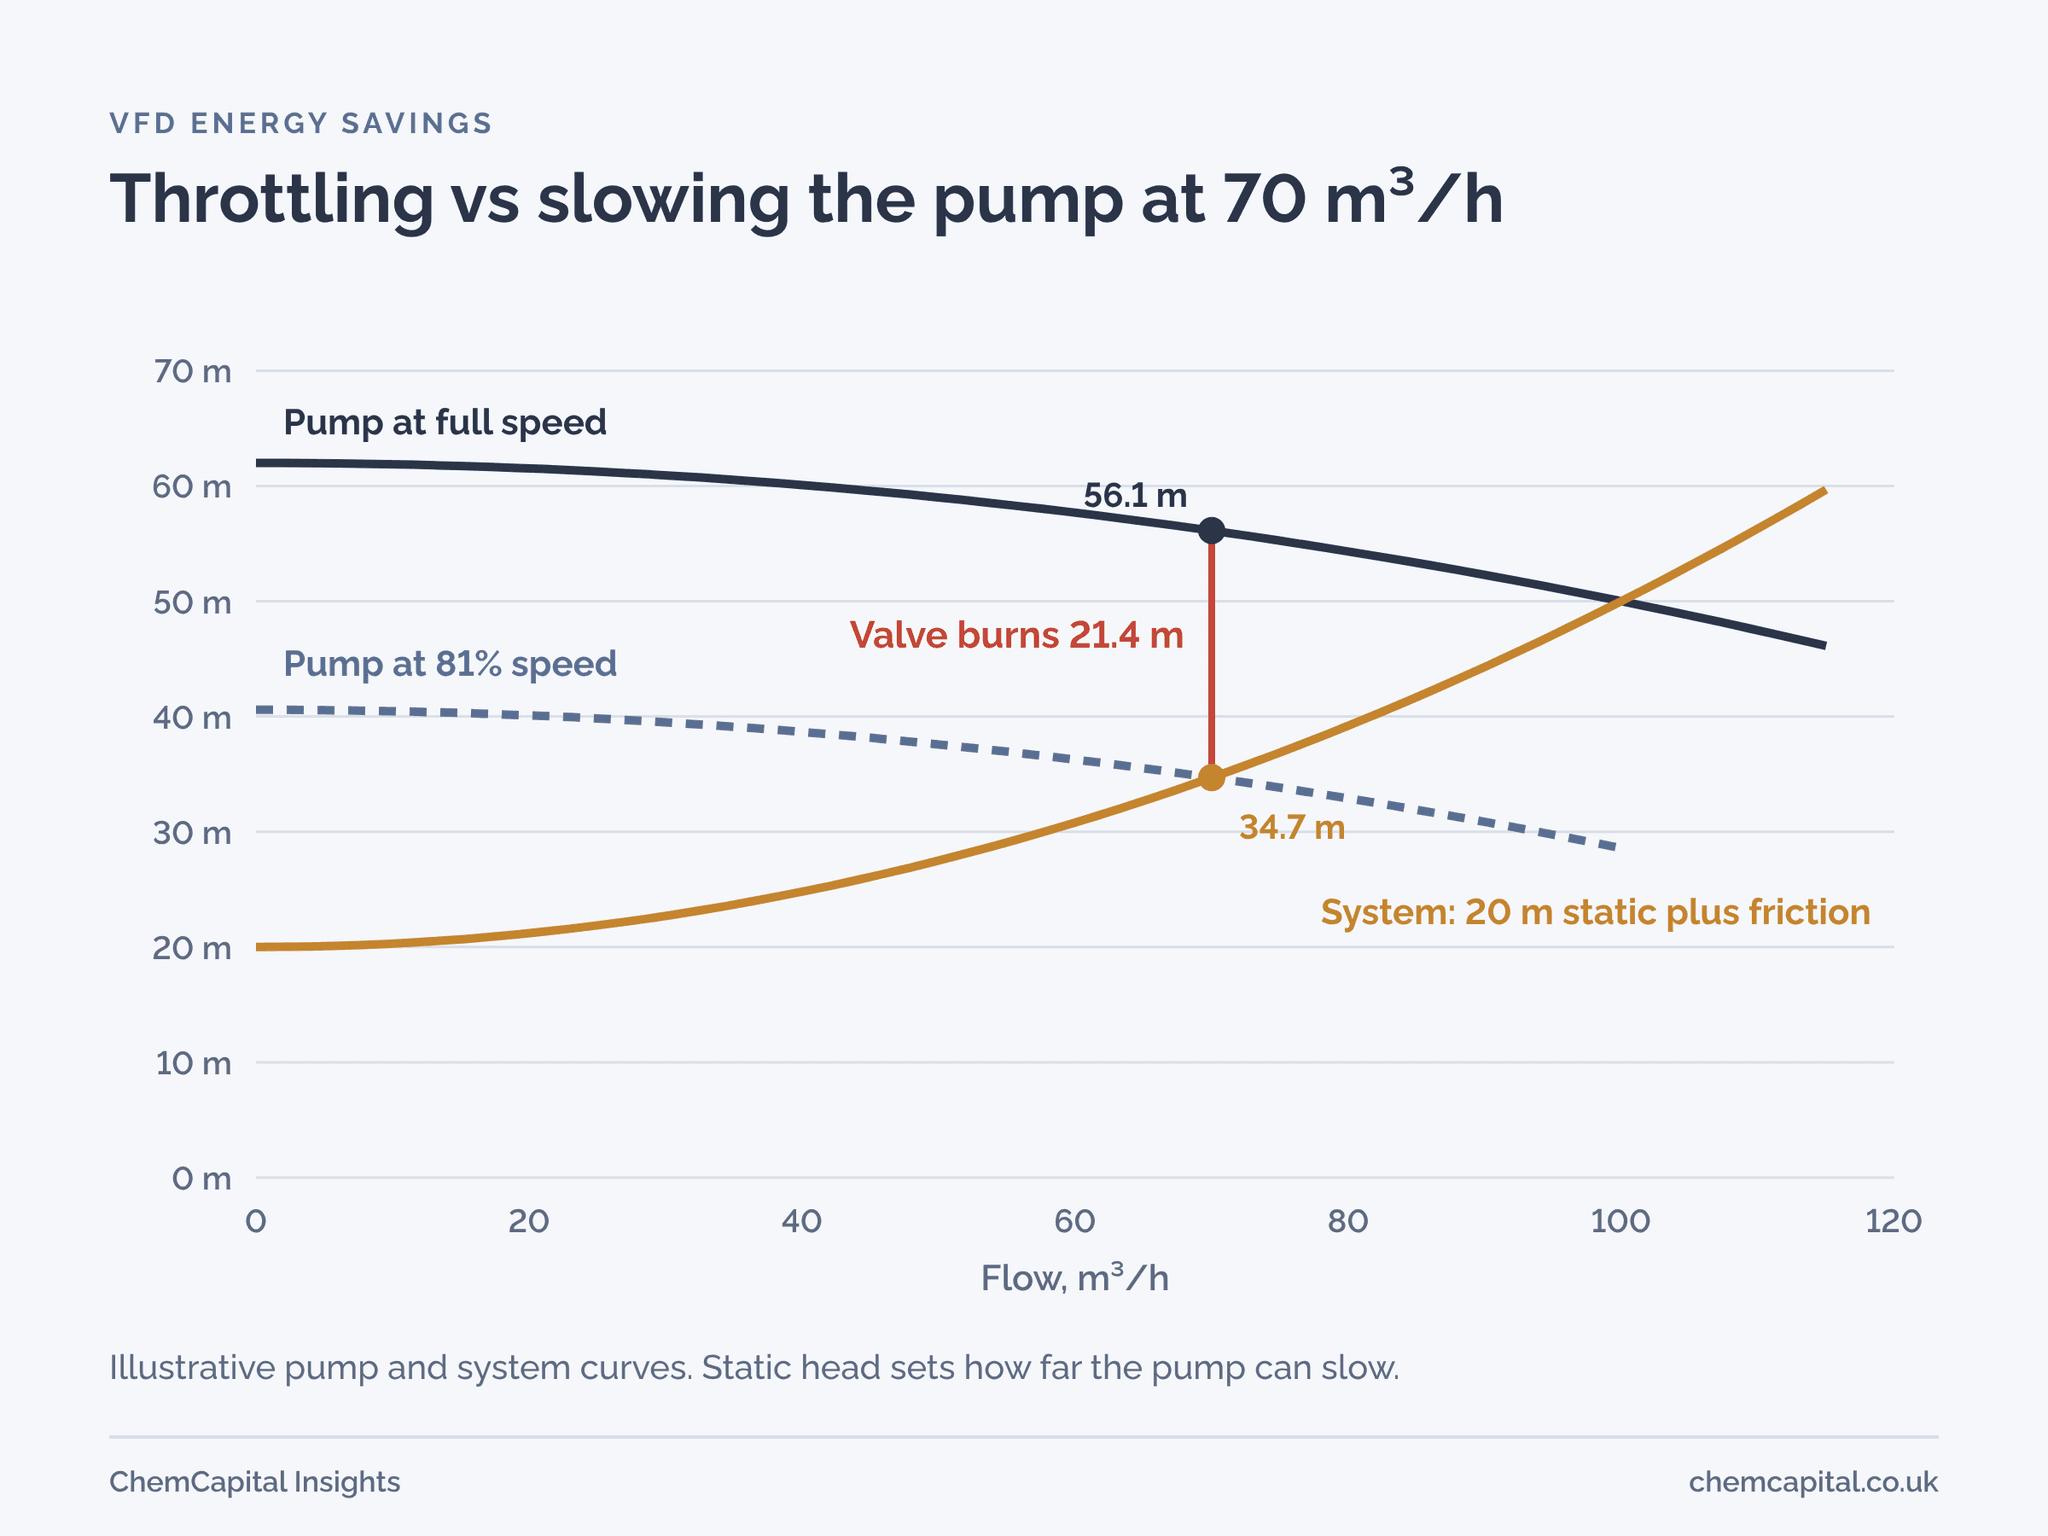
At 70 m³/h, throttled. The full speed pump makes 56.1 m at 69.3% efficiency. The system only needs 20 + 30 × 0.7² = 34.7 m, so the control valve burns 21.4 m. KSB notes that this is how the operating point is usually matched to the required duty: by throttling [5]. Shaft power: 998 × 9.81 × (70 ÷ 3,600) × 56.1 ÷ 0.693 = 15.4 kW. Electrical power: 15.4 ÷ 0.93 = 16.6 kW.
At 70 m³/h, variable speed. The pump slows to 81% of full speed, where its curve meets the system at 34.7 m. At that speed it works at the same point on its curve as 86.5 m³/h at full speed, with 76.3% efficiency. Shaft power: 998 × 9.81 × (70 ÷ 3,600) × 34.7 ÷ 0.763 = 8.7 kW. Electrical power: 8.7 ÷ 0.93 ÷ 0.96 = 9.7 kW.
| Flow | Hours a year | Throttled power | VFD speed | VFD power | Throttled energy | VFD energy |
|---|---|---|---|---|---|---|
| 100 m³/h | 1,600 | 18.7 kW | 100% | 19.3 kW | 29,997 kWh | 30,925 kWh |
| 70 m³/h | 4,000 | 16.6 kW | 81% | 9.7 kW | 66,285 kWh | 38,820 kWh |
| 50 m³/h | 2,400 | 16.0 kW | 70% | 6.0 kW | 38,399 kWh | 14,350 kWh |
| Total | 8,000 | 134,681 kWh | 84,094 kWh |
The drive saves 50,587 kWh a year, 37.6%. At an illustrative 20p per kWh, that is about £10,100 a year. If the drive costs £9,500 installed, simple payback is under a year.
Notice the full flow row: the drive costs energy there, because of its own losses. A pump that runs at full flow all year gains nothing from a drive.
The cube law would have predicted 5.98 kW of shaft power at 70 m³/h, against 8.7 kW in the proper calculation. Over a year that difference is large enough to turn a sound business case into an inflated one.
When a drive does not pay
Now give the same pump a system with 45 m of static head and only 5 m of friction at 100 m³/h, such as a pump lifting into a pressurised vessel. At 70 m³/h the pump can only slow to 93% of full speed, and at 50 m³/h to 89%, and its efficiency falls as it moves off its best point.
| System | Energy saved | Saving per year at 20p | Payback on £9,500 |
|---|---|---|---|
| 20 m static, 30 m friction | 37.6% | £10,100 | under 1 year |
| 45 m static, 5 m friction | 14.3% | £3,850 | about 2.5 years |
The drive still saves energy, as the guide says speed control always will [1], but the case is much weaker. With the same high static head and a pump that rarely leaves full flow, it may not pay at all. Static head, not pump size, is the first thing to check.
What to ask suppliers
- For a pump package with a drive: the pump curve at several speeds, the minimum continuous speed, and efficiency at each duty point.
- For a savings claim: the duty profile, system curve and drive and motor efficiencies behind it. A claim based on the cube law alone is a warning sign on any system with static head.
- For the drive: efficiency at part load and its cooling needs. The Variable Speed Pumping guide notes that converter losses must be removed by ventilation and that drive life depends on the temperature inside it [1].
Our guide to life cycle cost in equipment quotes shows how to put the energy figure into a bid comparison, and how to read a pump curve explains the curves to ask for. When the drive changes the motor duty, check the motor too; see IE3 vs IE4 motors.
ChemCapital's AI quotation comparison puts each bid's price, efficiency and power figures side by side, so you can feed the right numbers into the calculation above for every option.
Ready to compare pump and drive bids on running cost as well as price? Start a free 14 day ChemCapital trial, with no credit card needed.
Frequently asked questions
How do you calculate VFD energy savings on a pump?
For each operating flow, calculate electrical power with a throttling valve at full speed and with the pump slowed to meet the system curve, including motor and drive efficiencies. Multiply each by the hours at that flow and subtract. Use the system curve with its static head, not the cube law alone.
Do the affinity laws work for VFD savings?
Only on systems with little or no static head. Where there is static head, the pump cannot slow as far as the cube law assumes and its efficiency changes, so the affinity laws overstate the saving, sometimes by a lot.
When does a variable speed drive not save energy?
When the pump runs at or near full flow most of the time, because the drive's own losses then add to the energy used, and when the system is dominated by static head, because the pump can only slow a little.
How efficient is a variable frequency drive?
Typical PWM drives in the 20 to 30 horsepower range are about 97% efficient at full load and 95% to 96% at half load, falling sharply at very light load, according to US Department of Energy data.
Continue reading
Informational only, not procurement or legal advice. Cited names, frameworks, and statistics belong to their respective owners.
Create and manage RFQs in minutes
ChemCapital handles the entire procurement cycle, from structured RFQs and supplier comparisons to formal purchase orders and delivery tracking.
Start for freeRelated articles
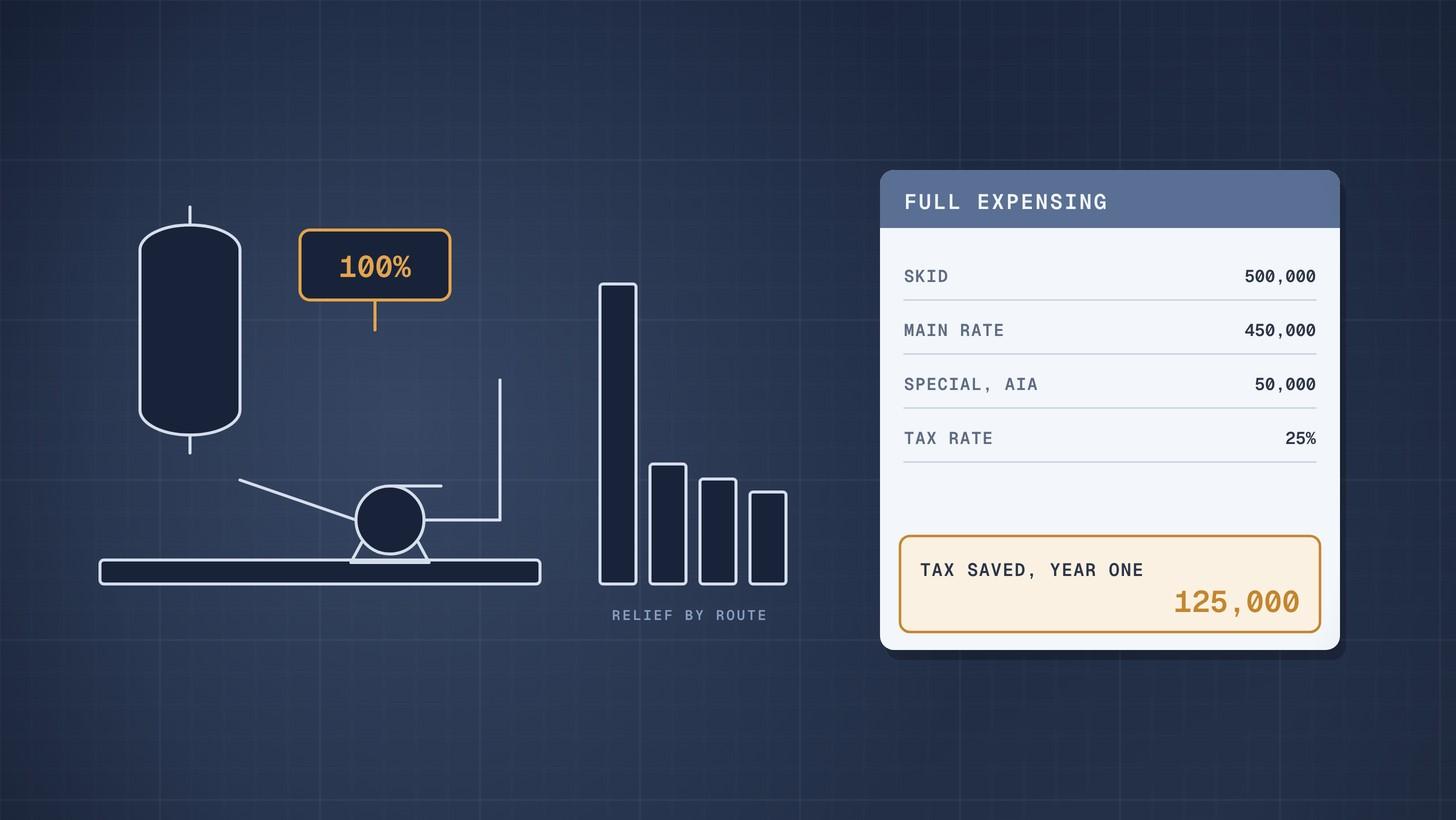
Full Expensing for Plant and Machinery: Worked Example (UK)
How full expensing, the annual investment allowance, first year allowances and writing down allowances apply to a £500,000 process skid, with the November 2026 rates.
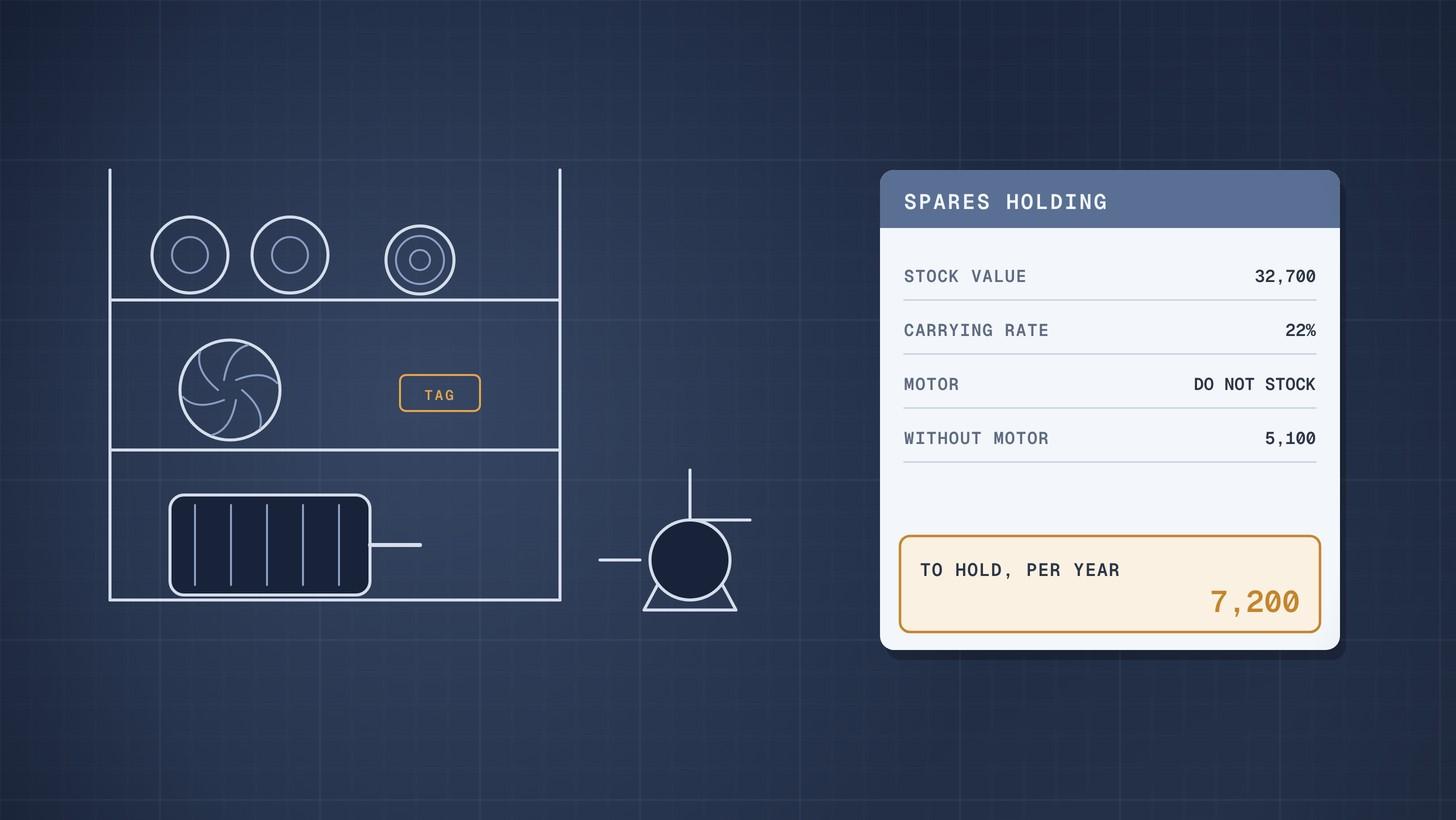
Spare Parts Carrying Cost: Worked Example
How to calculate the yearly carrying cost of spare parts, build your own carrying rate and decide which items on a recommended spares list are worth stocking.
Pump Total Cost of Ownership: Worked Example
How to calculate a pump's total cost of ownership with the Hydraulic Institute and Europump life cycle cost method, comparing two bids over 15 years in present value.